What Complete REDD+ Peatland dMRV Looks Like: Canal Blocking, Orangutan Sightings, and Weighted SDG Indicators in a Single Digital System
Digital MRV AI Biodiversity Credits
Project Type: REDD+ Peatland and Dryland Forest Conservation | Wetland Conservation (WRC) | AFOLU — REDD, WRC
Location: Barito Selatan and Kapuas Regencies, Central Kalimantan, Indonesia
Methodology: VM0007 (REDD+ Methodology Framework)

The Two Monitoring Challenges Every Peatland REDD+ Project Faces
REDD+ peatland projects carry two distinct monitoring burdens that run in parallel throughout the project lifetime, and they require fundamentally different types of evidence.
The first is physical. Peatland carbon permanence depends on keeping peat wet. Dry peat burns. Burning peat releases enormous quantities of stored carbon — Indonesia's peatland fires are responsible for some of the largest single carbon emission events ever recorded. The entire climate case for a peatland REDD+ project rests on the effectiveness of the rewetting intervention: are the canal blocks holding? Is water accumulating behind them? Is peat moisture being maintained at levels that prevent drying and combustion? Is vegetation returning to rewetted areas? This is the carbon verification layer, and it requires ongoing field monitoring that remote sensing alone cannot provide.
The second is social. Large-scale conservation projects in places like Central Kalimantan operate in landscapes where communities have lived for generations — people who fish in the waterways, harvest forest products, and whose livelihoods are bound up with the ecosystems being conserved. A REDD+ project that protects carbon stocks whilst ignoring the communities living alongside the forest is both ethically problematic and practically fragile. Communities that don't benefit from conservation have limited reason to support it. And increasingly, carbon buyers, CCB Standards validators, and impact investors want documented evidence that conservation is delivering genuine community co-benefits — on gender equality, on inequality, on biodiversity stewardship — not just narrative claims in a project design document.
This case study covers how a five-survey CitizenClimate package addresses both monitoring burdens simultaneously for a 39,853-hectare REDD+ peatland conservation project in Central Kalimantan.


Project Brief: REDD+ Peatland and Dryland Forest Conservation in Central Kalimantan
The project sits in the Barito Selatan and Kapuas Regencies of Central Kalimantan — a landscape of tropical forest comprising a mixture of dryland and peatland forest that was facing conversion to industrial forestry plantation. The project area covers 39,853 hectares of unallocated lands that had been assigned for conversion, placing both the dryland and peatland ecosystems within those boundaries under immediate deforestation threat.
The conservation intervention is structured around three activities. The project avoids 28,363 hectares of forest clearing that would have occurred under the business-as-usual conversion scenario. It avoids 8,824 hectares of peatland degradation through the conservation of wetlands and prevention of conversion. And it actively reforests 195 hectares of non-forest areas back into natural forest — a smaller but meaningful restoration component alongside the larger conservation footprint.
The methodology is VCS VM0007 — the REDD+ Methodology Framework, the most widely used methodology for tropical forest carbon projects globally. The project also pursues CCB (Climate, Community and Biodiversity) Standards, which require documented evidence of biodiversity and community co-benefits beyond the carbon calculation. The CCB standards are what makes the community SDG surveys and biodiversity monitoring not just good practice but a verification requirement.
At an estimated 1,113,970 VCS credits per year, this is a substantial project. The carbon volumes are significant. The monitoring burden is correspondingly large — and the community expectations, given the scale and the CCB commitment, are high.
Why Peatlands Specifically — and Why Rewetting Is the Critical Intervention
Tropical peatlands are among the most carbon-dense ecosystems on Earth. Peat is partially decomposed organic matter that has accumulated over thousands of years in waterlogged conditions. In the absence of oxygen — which waterlogging prevents — decomposition is dramatically slowed, and organic carbon accumulates rather than being released. Some tropical peat deposits in Kalimantan are ten metres deep or more, storing millennia of accumulated carbon in a single landscape.
The problem is what happens when you drain them. Industrial forestry and oil palm plantations require drainage canals to lower the water table and make peat land usable for agricultural purposes. Once drained, peat begins to oxidise and decompose. It also becomes combustible. The combination of drainage and fire — whether deliberate land clearing or accidental — can release carbon stocks that took thousands of years to accumulate in a matter of weeks.
This is why canal blocking is the central intervention in peatland rewetting projects. Blocking the drainage canals that have been cut to lower the water table reverses the drainage process, allowing the water table to rise and peat moisture to be restored. As peat rewets, oxidation slows, fire risk reduces, and the ecosystem begins recovering — vegetation returns, wildlife habitat is restored, and the carbon stocks become more stable.
But canal blocking only works if the blocks actually hold. A leaking earth dam that allows water to seep around it isn't delivering the rewetting the carbon calculation assumes. A block constructed from the wrong materials for the drainage conditions may fail under seasonal pressure. Monitoring whether canal blocks are performing as intended — holding water, raising water levels, maintaining peat moisture — is the most direct carbon verification activity a peatland REDD+ project can do.
That's what the Peat Swamp Rewetting Survey is built to capture.

The Peat Swamp Rewetting Survey: Documenting Canal Blocks From Construction to Water Level
The Peat Swamp Rewetting Survey is the primary carbon verification instrument for the rewetting component of the project. It is completed by community monitors at each canal block location, tracking construction type, structural integrity, water levels, peat moisture, vegetation response, and wildlife activity.
Survey configuration: GPS location enabled. Orange colour coding with Fish icon — a deliberate choice that connects visually to the aquatic ecosystem being restored. Continuous survey type, allowing monitors to record conditions at the same block across multiple visits and build a longitudinal record of rewetting progress. 15 reward points per submission. Currency reward of 5 units per submission enabled, with a Currency Reward Time Limit of 24 hours — meaning the currency reward is available for 24 hours after each submission, preventing gaming whilst still providing timely incentive.
Badge progression: First Surveyor (5 surveys), Water Level Tracker (20), Ecosystem Restorer (40), Wetland Guardian (60), Community Protector (100). The badge names track the arc of the monitoring work itself — from first engagement to community stewardship — and Wetland Guardian and Community Protector specifically connect the monitoring role to the conservation purpose.
Survey Field 1 — Type of canal block constructed (Multiple Choice, custom input, Required): Options: Earth/soil dam, Wooden planks, Concrete barrier, Stone/rock fill, Combination materials.
The construction material matters for durability assessment. An earth dam is the cheapest and most commonly constructed option but is also most vulnerable to seepage and erosion under sustained water pressure. Wooden plank dams are more durable but require maintenance. Concrete barriers are the most permanent but expensive. Stone/rock fill sits somewhere in between. Knowing which type of block is at each location allows project managers to prioritise maintenance visits and anticipate failure points — and gives verifiers the construction record they need to assess whether the infrastructure investment matches the rewetting claims.
Survey Field 2 — Signs of water leakage around block (Yes/No, Required): A simple required binary — is the block leaking? This is the most direct integrity check. A leaking block may still be providing some rewetting benefit, but the extent of that benefit is reduced and the verifier needs to know. Required status ensures this critical integrity check appears in every submission.
Survey Field 3 — Current water level behind block (Multiple Choice): Five plain-language categories: Very high (overflowing), High (near top of block), Medium (halfway up block), Low (below block height), No standing water.
This is the core rewetting effectiveness metric. The water level behind a canal block is the direct measure of whether the block is doing its job. Very high and High readings indicate the block is successfully retaining water and the rewetting process is advancing. Low and No standing water readings suggest the block is ineffective, has failed, or that drought conditions are preventing water accumulation. For a VM0007 carbon calculation that depends on maintained water table levels, this field creates the longitudinal evidence record that quantifies rewetting progress across the project area.
The plain-language descriptors — overflowing, near top of block, halfway up, below block height — are designed to be assessed visually without instruments. A community monitor standing at a canal block can classify the water level accurately without specialist training or equipment.
Survey Field 4 — Water quality behind block (Multiple Choice, Required): Five options: Clear, Slightly murky, Brown/muddy, Very dark, Stagnant/smelly.
Water quality behind canal blocks is an indicator of both hydrological function and ecosystem health. Clear water in a rewetted peatland suggests a functioning wetland ecosystem. Very dark water is actually typical of healthy peat swamp — the dark tannin colour of blackwater rivers is a natural characteristic of peatland hydrology. Stagnant/smelly water, by contrast, may indicate decomposition in a waterlogged area with poor flow, or contamination. This field captures the ecological character of the rewetted water body rather than just its level, providing a richer ecosystem health picture than water level alone.
Survey Field 5 — Peat moisture level near the block (Multiple Choice, Required): Five categories: Very wet/saturated, Moist, Slightly dry, Dry, Very dry/cracking.
Peat moisture near the block is a direct proxy for rewetting effectiveness. Very wet/saturated means the water table is high and the peat is functioning as it should. Very dry/cracking is an alarm signal — cracking peat is at elevated fire risk, and this reading should trigger immediate management attention. The five-category scale gives enough resolution to track gradual change over time — a block area that moves from Slightly dry to Moist across successive monitoring visits is evidence that rewetting is progressing.
Survey Field 6 — New plant growth since rewetting (Yes/No, optional): Optional rather than required — in early stages of a rewetting project, plant response may not yet be visible. But when it is, this yes/no captures one of the most meaningful ecological indicators: whether rewetted areas are beginning to recover natural vegetation. Returning vegetation indicates that the rewetting is sufficient to support plant establishment, which in turn supports habitat recovery and accelerating ecosystem carbon accumulation.
Survey Field 7 — Wildlife activity in rewetted area (Multiple Choice): Four options: Increased activity, Same as before, Decreased activity, No wildlife observed.
Wildlife response to rewetting is an important ecosystem health indicator. As water tables rise and vegetation recovers, peatland-dependent species — including birds, reptiles, and mammals that use wetland habitats — typically return to rewetted areas. Increased wildlife activity observed by community monitors is meaningful co-benefit evidence: it indicates that the rewetted habitat is becoming functional again. For a project pursuing CCB Standards alongside VCS VM0007, this field contributes directly to the biodiversity co-benefit evidence base.
Survey Field 8 — Photos taken during survey (Photo/Video, Low quality 640x480): Low quality compression for slow internet — consistent with the reality of monitoring in remote peatland areas of Central Kalimantan where mobile data connectivity is limited. GPS-tagged photos of canal blocks, water levels, and vegetation provide the visual audit trail that connects survey reports to real locations.
Survey Field 9 — Audio recording of bird calls (Audio Recording, Low quality 16 kbps mono): Bird call recording in a peatland rewetting survey is particularly meaningful. Peat swamp forests in Kalimantan support extraordinary bird diversity, including multiple endemic and endangered species that are directly dependent on waterlogged peat swamp habitat. As rewetting progresses and habitat recovers, bird species associated with peat swamp forest return — and their calls are detectable long before formal ornithological surveys would be conducted. Community monitors recording bird calls create a low-cost, continuous biodiversity monitoring record that supplements formal species surveys and provides ongoing ecosystem health evidence for CCB Standards verification.
The Biodiversity Survey: What Communities Know and What They're Seeing
The Biodiversity Survey captures two things that formal biological surveys conducted by external consultants typically miss: the depth of local ecological knowledge held by communities who have lived in this landscape for generations, and the real-time observations of people who move through the forest and waterways every day.
Survey configuration: GPS location enabled. Green colour coding with Nature icon. Continuous survey type. 15 reward points per submission. Currency reward of 5 units per submission. Same timeframe as the Peat Swamp Rewetting Survey: September to December 2025.
Description: "This survey helps us understand community knowledge and involvement in protecting Indonesia's native flora and fauna. Your responses will support local conservation."
Badge progression: Eco Beginner (5), Diversity Scout (20), Biodiversity Watcher (40), Nature Tracker (60), Ecosystem Hero (100). The progression from curious beginner to recognised ecosystem steward maps directly to the depth of engagement the platform is designed to build over time.
Survey Field 1 — Can you name 3 native plants in your area? (Text, optional): An open text field asking community members to name native plant species in their local area. Optional status is deliberate — this is an educational and engagement question as much as a data collection one. It assesses baseline ecological literacy and, over time, tracks whether engagement with the biodiversity survey is building community knowledge. A community member who couldn't name a single native plant at project start but can name three after a year of survey participation has undergone a measurable change in environmental awareness.
This is the education-first principle that differentiates CitizenClimate from extractive data collection: the survey itself is a learning experience, not just a data capture exercise.
Survey Field 2 — Can you name 3 native animals in your area? (Text, optional): The same principle applied to fauna. Open text, optional. Community knowledge of native animal species — which animals are present, where they're found, what habitats they use — is a form of ecological intelligence that formal surveys conducted by visiting biologists rarely capture in full. A fishing community who knows the peatland waterways intimately may know more about fish species distribution, seasonal movement, and habitat use than an ecologist who visits for two weeks. This field begins documenting that knowledge.
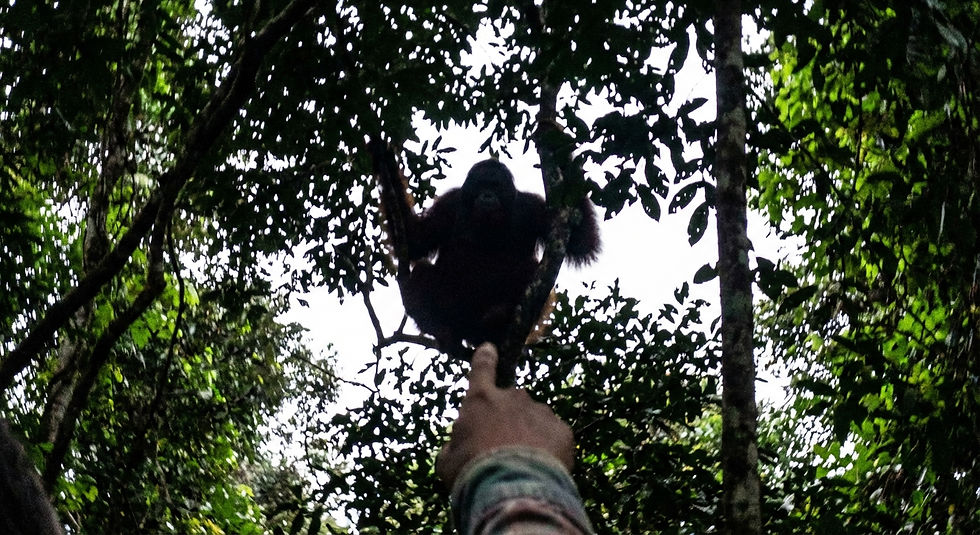
Survey Field 3 — Have you seen any of these endangered species in your area? (Multiple Choice, custom input, Required): Options: Orangutan, Sumatran Tiger, Javan Rhinoceros, Komodo Dragon, Sumatran Elephant, None.
This is the most striking field in the entire five-survey package. It presents community monitors with a list of Indonesia's most iconic endangered species and asks whether they've seen them.
The ecological significance is profound. Orangutans are peat swamp forest specialists in Kalimantan — their presence is one of the most direct indicators that the forest ecosystem is intact. Sumatran Tigers range across Sumatran and Kalimantan forest landscapes. Sumatran Elephants depend on intact lowland forest corridors. The presence of these species in community sighting records provides biodiversity evidence that is difficult to obtain any other way — formal camera trap surveys are expensive and cover limited areas; community sighting records from people who spend time in the forest every day create a distributed, continuous detection network.
Required status means every biodiversity survey submission includes a threatened species observation record — or an explicit None. The absence of observations is itself data: it tracks whether habitat degradation is continuing or whether rewetting and conservation are beginning to support species presence.
Custom input allows monitors to record species that aren't on the preset list — local species names, species not included in the preset options, or observations that don't fit the categories. This is important in a landscape as biodiverse as Central Kalimantan, where the preset list covers headline species but not the full diversity of what communities might observe.
Survey Field 6 — Have you observed any of these threats in your area? (Multiple Choice, custom input, Required): Options: Illegal logging, Forest fires, Land clearing for agriculture, Pollution in rivers/streams, Hunting of protected species, Littering in natural areas, None observed.
Community threat reporting is one of the most practically valuable outputs of the biodiversity monitoring system. Illegal logging and hunting of protected species are real threats in Central Kalimantan — and formal ranger patrols cannot be everywhere. Community monitors who observe these activities and report them through the survey system create a real-time threat intelligence layer that complements patrol-based monitoring.
Forest fire observations are particularly important for this peatland project. A community monitor reporting smoke or active burning in a rewetted area can trigger an immediate management response — potentially preventing the kind of peat fire that would release years of accumulated carbon in hours. The GPS location attached to each fire observation record gives project managers the spatial precision to respond effectively.
The Pro Metrics Weighted SDG System: How Scored Indicators Replace Narrative Co-Benefit Claims
The three SDG Pro Metrics surveys — SDG 15, SDG 5, and SDG 10 — represent the most technically sophisticated element of the monitoring package. They go beyond collecting community responses and produce quantified, weighted impact scores that map directly to official UN SDG indicator numbers.
The difference between a standard survey question and a Pro Metrics weighted question is fundamental. A standard survey asks a question and records a response. A Pro Metrics question assigns a numerical score to each possible response and applies a weight to the question itself — reflecting how significant this indicator is within the broader SDG. The final output is a composite score for each SDG that represents measurable, comparable, auditable impact rather than a collection of responses that someone has to interpret narratively.
This matters enormously for CCB Standards verification and for carbon buyers who are increasingly being asked to demonstrate that their purchased credits deliver genuine community and biodiversity co-benefits. A score of 2.8 out of 3.0 on SDG 15 Life on Land, calculated from weighted field-level survey data mapped to indicator 15.1.2, is a fundamentally different evidence quality than a narrative paragraph in a project report stating that "the project supports biodiversity conservation."
SDG 15: Life on Land (Pro Metrics Survey)
Configuration: GPS enabled. Green colour coding with Star icon. Continuous survey type. 30 reward points — the highest point value in the suite, reflecting the complexity and importance of this survey. No currency reward, consistent with the principle that SDG impact data should be reported honestly without heavy financial incentivisation.
The survey assesses the conservation project's impact on protecting forests, land, and biodiversity. Questions are mapped to specific SDG 15 indicator numbers, with weighted scores that produce a composite SDG 15 impact score from community-reported field data.
SDG 5: Gender Equality (Pro Metrics Survey)
Configuration: GPS enabled. Purple colour coding with Star icon — visually distinct from the green nature surveys, signalling a different domain. 30 reward points. No currency reward.
The survey assesses the conservation project's impact on promoting gender equality and women's empowerment in communities adjacent to the project area.
Survey Field 1 — Customary law and tradition question (Weight 1.6, SDG Indicator 5.1.1): Asks whether customary laws or traditions in the community align with or contradict gender equality principles. Response options: Yes strongly agree (score 3), Yes somewhat agree (2), Not sure (1), No somewhat disagree (0), No strongly disagree (0). SDG Indicator 5.1.1 specifically measures whether legal frameworks are in place for promoting, enforcing, and monitoring equality — the weight of 1.6 reflects the relative significance of this legal/customary framework question within the composite SDG 5 score.
The scoring logic here is important: both "No, somewhat disagree" and "No, strongly disagree" receive a score of 0 rather than -1. This is a methodologically sound choice. The SDG 5 indicator measures whether positive frameworks exist, not whether negative ones are active — the absence of alignment is captured as zero contribution rather than as a net negative against the score.
Survey Field 6 — Early marriage question (Weight 1.9, SDG Indicator 5.3.1): Asks whether the respondent knows of any girl between the ages of 15 and 18 who has been married. Response options: No (score 3), Yes (score 0), Not sure (score 1). SDG Indicator 5.3.1 measures the proportion of women who were first married before age 18. The weight of 1.9 — the highest in the SDG 5 survey — reflects the significance of child marriage as one of the most direct measures of gender inequality in conservation-adjacent communities. A No response (score 3) means no known cases of child marriage in the community; Yes (score 0) means a case is known.
This question requires careful handling in community engagement. Its inclusion in the survey reflects the CCB Standards expectation that gender co-benefits are genuine and documented — not assumed. It should be administered with appropriate community facilitation and sensitivity.
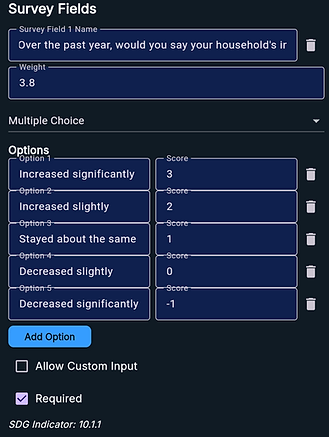
SDG 10: Reduced Inequalities (Pro Metrics Survey)
Configuration: GPS enabled. Purple colour coding with Star icon. 30 reward points. No currency reward.
The survey assesses the conservation project's impact on reducing inequalities, with questions mapped to SDG 10 indicators and weighted scores producing a composite SDG 10 impact score.
Survey Field 2 — Bottom 40% income growth question (Weight 3.2, SDG Indicator 10.1.1): "Thinking about the poorest 40% of people in our community — has the conservation project helped increase their income or economic opportunities?" Response options: Yes definitely (score 3), Yes possibly (2), No change or unsure (1), No possibly not (0), No definitely not (-1).
This is the most analytically sophisticated question in the entire five-survey package. The weight of 3.2 is the highest of any field in any survey, reflecting the central importance of SDG Indicator 10.1.1 — which measures income growth of the bottom 40% of the population. It is the direct quantitative measure of whether inequality is actually being reduced.
The scoring scale here is also the only one in the package that includes a negative score: No, definitely not receives -1. This means a project that community members believe is actively harming the economic circumstances of the poorest 40% will produce a negative contribution to the SDG 10 composite score. This is methodologically rigorous — and commercially honest. A carbon buyer purchasing credits from a project that scores negatively on SDG 10 indicator 10.1.1 is buying something very different from one that scores 3.0. The weighted scoring system makes that difference quantifiable and auditable.


What the Five-Survey Package Looks Like for VM0007 and CCB Verifiers
A verification body reviewing this project's monitoring data has access to an evidence package that is substantially more complete than what most REDD+ peatland projects can provide.
The carbon layer includes GPS-tagged canal block monitoring records documenting construction type, structural integrity, water levels, peat moisture, and vegetation response from multiple visits across the monitoring period. Water level trends behind canal blocks over time provide direct evidence of rewetting progress. Peat moisture records document whether the rewetting is reaching the soil. Photo evidence ties each record to a specific GPS location.
The biodiversity layer includes community-reported endangered species sighting records — Orangutan, Sumatran Tiger, Sumatran Elephant — that contribute to the CCB biodiversity co-benefit evidence base, alongside threat monitoring records that document illegal logging, fire observations, and hunting of protected species in near real-time. Bird call audio recordings provide continuous acoustic biodiversity monitoring across the project area.
The community co-benefit layer provides three quantified SDG impact scores — for SDG 15, SDG 5, and SDG 10 — calculated from weighted field-level survey data mapped to specific UN SDG indicator numbers. These are not narrative assessments or checkbox responses. They are composite scores derived from a rigorous weighted scoring methodology, mapped to the same indicators that national governments use to report SDG progress. For CCB Standards verification, this is the difference between claiming co-benefits and evidencing them.
What This Five-Survey Package Means for VM0007 REDD+ Project Developers
The monitoring approach developed for this project is directly applicable to other VM0007 REDD+ peatland projects, wetland conservation initiatives, and REDD+ projects pursuing CCB Standards across the Global South.
The Peat Swamp Rewetting Survey is configurable to different canal block types and different peatland contexts. Projects in Sumatra, Papua, or the Congo Basin working with different peat swamp ecosystems can adapt the question set to their specific hydrology and vegetation context whilst retaining the core rewetting verification logic.
The biodiversity survey's endangered species list is configurable to the target landscape. A project in Sumatra would include Sumatran Rhinoceros and Sun Bear. A project in West Africa might list Forest Elephant and Western Chimpanzee. A project in Amazonia would include Giant Otter and Harpy Eagle. The community ecological knowledge questions and threat monitoring questions apply universally.
The Pro Metrics weighted SDG surveys are the most transferable element of the package. SDG indicator numbers don't change between landscapes. A weighted question mapped to SDG Indicator 10.1.1 works equally well in Central Kalimantan, rural Bolivia, or West Africa. The scoring weights and response scales are calibrated to international SDG measurement standards — once configured, they produce comparable, auditable impact scores regardless of project geography.
For project developers who are facing increasing pressure from CCB Standards validators, VCMI framework requirements, and corporate carbon buyers demanding documented co-benefit evidence, this five-survey package provides the complete monitoring infrastructure to meet those requirements — collected by communities, on GPS-enabled smartphones, accessible from a single dashboard.
Your Project
Could Work Like This
If you're working on a climate or environmental project that needs verified community data, you're probably facing similar questions to the ones in this case study.
How do you prove your project is working beyond just the technical metrics? What data do your funders need for carbon credits or ESG reporting? How do you catch problems on the ground before they undermine your results? Most importantly—how do you ensure the people affected by your project actually understand and benefit from it?
The difference between projects that succeed and ones that struggle often comes down to whether you're measuring the right things. Carbon calculations tell you about emissions. Community feedback tells you whether the intervention is actually working in practice. Education ensures that feedback is informed, not just reactive.
We've built the survey systems, education modules, and geotagged monitoring tools that made this project work. The same approach adapts to your context—different activities, different locations, different communities, different objectives.
What you get:
-
Custom education modules that teach participants about what they're monitoring and why it matters
-
Multilingual surveys designed for offline use in areas with limited connectivity
-
GPS-tagged responses that show location-specific patterns and problems
-
Anonymous feedback systems that protect privacy whilst collecting honest data
-
Verified data packages that meet carbon credit, MRV, and ESG reporting requirements
-
Operational insights that help you fix problems before they become failures
What your project needs:
-
A climate, environmental, or development initiative (planning stage or already operating)
-
Community members whose participation and feedback would strengthen your project
-
Funders or stakeholders who want proof of impact alongside technical metrics
The platform works whether you're monitoring 10 hectares or 10,000, whether you're in a remote village or an urban centre, whether your participants speak Spanish, English, French, Hindi, Indonesian, or Ukrainian.
Get Started
If you're working on a project that needs more than just technical data—where community engagement and verified feedback actually matter—let's talk about how this approach could work for you.
Or if you're not sure whether this approach fits your situation, send us a quick message describing what you're trying to achieve. We'll tell you honestly whether education-based community monitoring makes sense for your context.
Email us: nick@citizenclimate.net