Indian Smallholders Turn Barren Land into Forests: When Tree Planting Meets Community Verification
Digital MRV AI Soil Health Carbon
Project Type: Agroforestry & Community Reforestation | ARR Carbon Credits
Location: Telangana State, India (8 districts: Vikarabad, Ranga Reddy, Mahabub Nagar, Narayanapet, Sanga Reddy, Jogulamba Gadwal, Wanaparthy, Medchal)
Methodology: VCS VM0047 - Community-verified tree planting with biodiversity monitoring and socio-economic impact tracking

When Your Land Won't Feed You Anymore
Telangana's farmers face a problem that's become depressingly common across semi-arid India. They own land—sometimes just a hectare or two, occasionally less—but that land can't support them. The soil is degraded from decades of marginal agriculture. Rainfall is unpredictable and declining. Traditional crops barely yield enough to justify the labour and input costs. Many farmers have portions of their holdings that are essentially barren—too poor for cultivation, too scattered or small for commercial forestry, just sitting there contributing nothing to family income whilst slowly eroding further.
For tribal communities in particular, this land degradation compounds existing poverty. They depend on natural resources more than most—forest products, grazing land, water sources. When ecosystems degrade, they feel it first and hardest. They also typically have the least access to capital, extension services, and markets that might help them transition to more viable land uses.
Project Developer saw an opportunity in this challenge. Ten thousand hectares of marginal agricultural land and barren ground across eight districts of Telangana. Thousands of smallholder and tribal families who owned that land but couldn't make it productive. And a straightforward proposition: plant trees that generate multiple income streams—fruit, timber, medicinal products—alongside carbon credits from verified reforestation. Turn degraded land into functioning agroforestry systems that sequester carbon, restore biodiversity, improve soil and water, and actually pay farmers.
Six million trees planted between 2021 and 2023. Mango, sandalwood, guava, teak, neem, mahogany, pomegranate, agarwood—species chosen for both ecological suitability and economic value. Not monoculture timber plantations that might sequester carbon but provide limited community benefit. Mixed agroforestry that mimics natural forest structure whilst generating diverse products farmers can harvest and sell.
The carbon accounting looks solid: 262,253 tonnes of CO₂ equivalent sequestered annually over a 30-year crediting period under VCS VM0047 methodology. But the harder question is verification. When you have thousands of smallholders planting trees across scattered parcels in eight districts, how do you prove the trees are actually planted, actually surviving, actually growing as projected? How do you verify biodiversity is returning, soil is improving, communities are genuinely benefiting?
Traditional monitoring would require armies of auditors visiting thousands of farms repeatedly. Prohibitively expensive. The alternative: give the communities themselves the tools to document what they're doing and what's happening on their land.

The Multi-Benefit Model: Why Agroforestry Works Where Monoculture Fails
Before diving into the monitoring approach, it's worth understanding why this agroforestry model addresses problems that simpler tree planting programmes can't solve.
Economic diversification matters. A farmer planting only timber trees waits 15-20 years for income. Most smallholders can't afford that timeline. The species mix provides staggered returns:
-
Fruit trees (mango, guava, pomegranate, amla, sapota) start producing within 3-5 years. Annual harvest income while other trees mature.
-
Timber species (teak, mahogany, rosewood, she-oak) provide long-term high-value products after 15-20 years.
-
Medicinal/aromatic trees (sandalwood, neem, agarwood) generate premium products with established markets.
-
Carbon credits provide revenue throughout the growth period based on verified sequestration.
This income diversity reduces risk. If fruit prices drop one year, timber is still growing. If timber markets soften, medicinal products still sell. Carbon credits provide baseline revenue regardless of commodity fluctuations.
Ecological function improves with diversity. Monoculture plantations are ecologically fragile. Pests spread rapidly. Disease can devastate entire stands. Single-species canopies don't support much biodiversity. Mixed agroforestry creates complex habitat:
-
Multiple canopy layers support different bird species, insects, small mammals
-
Flowering/fruiting diversity provides year-round food sources for pollinators and wildlife
-
Root system diversity improves soil structure and water infiltration at different depths
-
Nitrogen-fixing species (certain acacias) improve soil fertility for the whole system
The biodiversity return isn't incidental—it's integral to system resilience and productivity.
Community ownership is inherent. These are private smallholder farms, not government plantations or corporate concessions. Farmers make planting decisions, manage their trees, harvest products, earn income. They have every incentive to ensure trees survive and thrive because their livelihoods depend on it. That intrinsic motivation makes monitoring easier—farmers aren't just compliance subjects, they're active stakeholders who want to document success.

The Surveys: Communities Document Their Own Reforestation
The monitoring system uses multiple survey types to capture different aspects of the agroforestry transition. Each serves specific verification needs whilst remaining simple enough for busy farmers to complete.
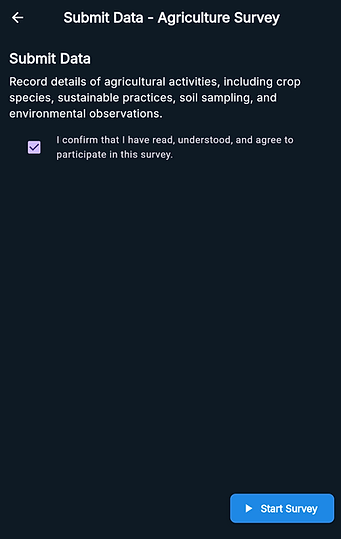
Agriculture Survey (Baseline & Transition Tracking)
This survey establishes what land was like before tree planting and tracks the transition from marginal agriculture to productive agroforestry.
Record details of agricultural activities, including crop species, sustainable practices, soil sampling, and environmental observations.
Consent checkbox: "I confirm that I have read, understood, and agree to participate in this survey."
The questions capture:
What crops were you growing before tree planting?
Multiple selection:
-
Cereals (sorghum, millet, maize)
-
Pulses (pigeon pea, black gram, green gram)
-
Cotton
-
Vegetables
-
Nothing/fallow
-
Other (specify)
Why this matters: Establishing baseline land use proves "additionality"—that carbon sequestration is genuinely new, not just business-as-usual forestry. If land was already forested or highly productive agriculture, tree planting isn't additional. Documenting marginal crops or fallow land proves the land wasn't sequestering much carbon before intervention.
What were your crop yields in the three years before tree planting?
Numerical input with year selection
Why this matters: Low/declining yields on marginal land strengthen the additionality case. They also demonstrate economic incentive for transition—farmers weren't abandoning productive agriculture for trees, they were replacing failed agriculture with agroforestry that might actually generate income.
What sustainable practices are you now using?
Multiple selection:
-
Organic mulching
-
Composting
-
Water harvesting structures
-
Contour planting
-
Mixed species planting
-
Soil conservation measures
-
Reduced chemical inputs
-
None yet
Why this matters: Agroforestry works best when combined with broader sustainable land management. Mulching reduces water stress on establishing trees. Contour planting prevents erosion. Mixed species planting enhances biodiversity. Documenting these practices shows farmers are adopting comprehensive approaches, not just planting trees and hoping.
How has soil quality changed since tree planting?
Rating scale:
-
Much improved (visible organic matter, better moisture retention)
-
Somewhat improved
-
No change yet (too early to tell)
-
Somewhat degraded
-
Much degraded
Why this matters: Soil improvement is both a co-benefit of agroforestry and an indicator that systems are functioning. Tree litter adds organic matter. Root systems improve structure. Reduced tillage protects soil. Farmer observations of soil changes validate that ecological benefits are occurring, not just carbon sequestration.
Photo: Take a photo of your land showing current condition
Camera/gallery upload with GPS tagging
Why this matters: Visual documentation of land condition. AI can analyse photos for vegetation cover, soil exposure, tree density, signs of erosion or improvement. Over years, photo series from the same GPS location shows transformation from barren/degraded land to establishing agroforestry.
Tree Planting Survey
This is the core verification survey documenting what species farmers planted, when, where, and in what quantities.
Question 1 of 6: Common Tree Species
Multiple selection:
-
Teak (Tectona grandis)
-
Neem (Azadirachta indica)
-
Mahogany (Swietenia mahagoni)
-
Acacia (Acacia spp.)
-
Baobab (Adansonia digitata)
-
Pine (Pinus spp.)
-
Eucalyptus (Eucalyptus spp.)
-
Other
-
Other (specify)
Why this matters: Species documentation is essential for carbon accounting. Different species sequester carbon at different rates, have different growth patterns, different survival rates. The VM0047 methodology requires accurate species-level data to calculate creditable carbon. The list includes both the planned species (teak, neem, mahogany) and other common species farmers might plant independently, plus "other specify" to capture anything unexpected.
How many trees did you plant?
Numerical input
Why this matters: Tree count is the fundamental unit for carbon calculation. Number of trees × species-specific growth rates × survival rates = total carbon sequestration. Without accurate planting counts, carbon claims are unsupportable. Farmer-reported numbers get verified through satellite imagery analysis (canopy cover) and periodic field sampling, but farmer documentation provides the ground-truth baseline.
When did you plant these trees?
Date selection (month/year)
Why this matters: Planting date determines how much growth should have occurred by verification time. A tree planted in 2021 should be significantly larger than one planted in 2023. Dating enables growth-rate verification—do trees show expected size for their age? Discrepancies flag problems (poor survival, mis-reporting, or exceptional conditions).
What planting pattern did you use?
Multiple choice:
-
Mixed species (different species interplanted)
-
Row plantation (species in separate rows)
-
Boundary plantation (trees on field edges)
-
Block plantation (species grouped in blocks)
-
Random/scattered
-
Other (specify)
Why this matters: Planting pattern affects biodiversity outcomes and management. Mixed planting creates more diverse habitat but can complicate species-specific monitoring. Block planting simplifies management but provides less ecological diversity. Boundary planting maximizes agricultural land use but limits carbon sequestration per hectare. Pattern documentation helps interpret monitoring results and guides management recommendations.
Have you added any nitrogen-fixing species?
Yes/No with follow-up
If yes: Which species?
-
Acacia species
-
Gliricidia
-
Leucaena
-
Sesbania
-
Other (specify)
Why this matters: Nitrogen-fixing trees improve soil fertility for the whole system, reducing need for chemical fertilizers. Their presence indicates sophisticated agroforestry design focused on ecosystem function, not just tree planting. Verification standards increasingly recognize nitrogen fixation as a co-benefit worth documenting.
What is the current survival rate of your trees?
Percentage estimate with confidence indicator:
-
Very confident (counted recently)
-
Somewhat confident (estimated)
-
Not sure (haven't checked)
Why this matters: Survival rate is critical for carbon accounting. If 1,000 trees were planted but only 600 survived, carbon calculations must use 600, not 1,000. Farmer estimates (especially "very confident" counts) provide interim data between formal verification visits. Over time, comparing farmer estimates with verification counts shows whether farmer monitoring is reliable—building trust or flagging need for training.
Photo: Take a photo showing your tree plantation
Camera/gallery upload with GPS tagging
Why this matters: Visual proof of planting. AI analyses photos for tree density (does it match reported planting count?), species identification (comparing farmer-reported species to visible characteristics), tree health and size (appropriate for reported planting date?), overall plantation condition. GPS tagging links photos to specific parcels, enabling verification that photos are from the farmer's actual land, not borrowed images.
Question 4 of 6: Audio Recordings for Birds
Why this matters: Bird diversity is one of the clearest indicators that agroforestry is creating functional habitat, not just carbon storage. Degraded agricultural land typically has low bird diversity—few species, mostly generalists adapted to disturbed environments. As trees mature and create canopy structure, fruit, flowers, and insects, bird diversity increases. Different species arrive as habitat develops: cavity nesters when trees are large enough to have holes, frugivores when trees produce fruit, raptors when small mammal populations recover.
Audio recording is ideal for birds because:
-
Many species are hard to see but easily heard through distinctive calls
-
Recording captures multiple species simultaneously
-
AI can identify species from audio recordings with high accuracy
-
Seasonal patterns become evident (migratory vs resident species)
-
Time-series analysis shows biodiversity trajectory over years
Farmers record birds during morning hours (peak calling time), submit recordings with GPS tags. AI identifies species present. Project monitors track: number of species over time, appearance of specialist species indicating habitat quality, presence of threatened species showing conservation value.
This isn't just ecological monitoring for its own sake—bird diversity increasingly affects carbon credit prices. Projects demonstrating strong biodiversity co-benefits command premium prices from buyers seeking high-integrity credits.
Mangrove Survey (For Coastal/Wetland Restoration Components)
Whilst the main Telangana project focuses on dryland agroforestry, the monitoring system includes mangrove surveys for projects with coastal restoration elements.
Question 1 of 6: Common Mangrove Species
Multiple selection:
-
Red Mangrove (Rhizophora mangle)
-
Black Mangrove (Avicennia germinans)
-
White Mangrove (Laguncularia racemosa)
-
Grey Mangrove (Avicennia marina)
-
Loop-root Mangrove (Rhizophora mucronata)
-
Milky Mangrove (Ceriops tagal)
-
Bruguiera (Bruguiera gymnorrhiza)
-
Other (specify)
Question 2 of 6: Number Planted
Numerical input field (example shows "100")
The mangrove survey follows similar logic to tree planting but recognizes mangrove-specific characteristics:
Survival challenges are different. Mangroves face tidal inundation, salinity, sediment dynamics. Survival rates are often lower initially but stabilize once trees establish. Monitoring needs to account for these patterns.
Blue carbon value is higher. Mangrove systems sequester carbon in both biomass and sediment—often 3-5x more per hectare than terrestrial forests. Accurate documentation supports premium carbon credit pricing.
Coastal protection value matters. Mangroves buffer storm surge, reduce erosion, protect inland areas. Documenting these co-benefits strengthens project value beyond just carbon.
Biodiversity is exceptional. Mangroves support unique fish, bird, invertebrate communities.
Many species depend entirely on mangrove habitat. Monitoring biodiversity return demonstrates conservation impact.
How Community Documentation Creates Verifiable Carbon Credits
Here's the critical piece: how does farmer-generated data translate into carbon credits that buyers trust?
Step 1: Baseline Documentation
Before tree planting (or retrospectively for trees already planted), farmers document baseline conditions:
-
Land use history (agriculture surveys showing marginal productivity)
-
Initial land condition (photos showing degraded/barren state)
-
Soil quality at start
-
Absence of significant tree cover
This baseline proves additionality and sets the reference point for measuring change.
Step 2: Planting Documentation
As farmers plant trees, they document:
-
Species planted (matching approved project species list)
-
Planting dates and quantities
-
Planting patterns and spacing
-
Initial survival assessments
This creates the ground-truth inventory of what was planted where and when.
Step 3: Continuous Growth Monitoring
Throughout the growing seasons, farmers document:
-
Tree survival rates (self-reported estimates)
-
Growth observations (height, diameter for sample trees)
-
Health status (pest problems, disease, drought stress)
-
Management activities (pruning, fertilizing, protecting from livestock)
-
Photos showing plantation development over time
This continuous data stream shows trees are surviving and growing as expected for carbon calculations.
Step 4: Biodiversity & Co-Benefits Tracking
Farmers document ecological recovery:
-
Bird audio recordings showing species diversity increasing
-
Observations of wildlife returning (insects, small mammals, reptiles)
-
Soil improvement assessments
-
Water retention improvements
These co-benefits don't directly generate carbon credits (under VM0047), but they increasingly affect credit prices and project credibility.
Step 5: Satellite Verification Layer
Farmer-reported data integrates with satellite Earth Observation:
-
Vegetation indices (NDVI) confirm increasing biomass matching farmer reports
-
Canopy cover analysis verifies tree counts are plausible
-
Change detection shows land transformation from baseline
-
Comparison with surrounding areas confirms project areas are genuinely different from business-as-usual land use
When farmer data matches satellite data, both become more credible. When discrepancies appear, they flag areas for field verification.
Step 6: Statistical Field Sampling
Verification bodies conduct periodic field visits to statistically sample:
-
Actual tree counts in random plots (compared to farmer reports)
-
Tree measurements (height, diameter) to validate growth models
-
Species identification to confirm farmer reports
-
Survival rates measured directly vs farmer estimates
Small sample plots across the 10,000 hectare project area provide high-confidence verification without requiring every tree on every farm to be measured. Sampling design ensures statistical validity whilst keeping verification costs manageable.
Step 7: Carbon Calculation & Crediting
Verified data feeds into VM0047 methodology calculations:
-
Number of trees (sampled verification + farmer reports)
-
Species mix (confirmed through sampling + photos)
-
Survival rates (measured + farmer-reported trends)
-
Growth rates (measured samples + species-specific models) = Total biomass accumulation = Carbon sequestration = Creditable tonnes CO₂e
Conservative approach: Where farmer reports exceed verification sampling, use the more conservative estimate. Where survival rates are uncertain, apply discount factors. This ensures carbon claims are defensible.
Step 8: Credit Issuance & Revenue
Once carbon sequestration is verified:
-
VCS registry issues credits based on verified tonnes
-
Credits sold to buyers seeking high-quality ARR offsets
-
Revenue flows back to Project Developer
-
Farmers receive payments based on verified carbon from their land
The farmer documentation isn't replacing verification—it's making verification efficient enough to be economically viable at scale. Without farmer data, verifying 10,000 hectares across thousands of smallholder plots would be prohibitively expensive. With farmer data providing continuous monitoring, verification bodies can use targeted sampling to confirm accuracy, dramatically reducing costs whilst maintaining credibility.


What the Data Reveals: Patterns Across 10,000 Hectares
As thousands of farmers across eight districts upload documentation over seasons, patterns emerge that guide project management and improve outcomes.
Species Performance Varies by District
Teak thrives in certain soil types and rainfall zones but struggles elsewhere. Farmers in Vikarabad district report higher teak survival and growth than farmers in drier Jogulamba Gadwal. Photo documentation and survival rate reports show which species succeed where, allowing project managers to refine planting recommendations by location rather than using blanket advice.
Planting Timing Affects Survival
Farmers who planted just before monsoon onset report 70-80% survival. Those who planted mid-monsoon or late monsoon report 50-60% survival. This timing effect is clearest in photo documentation—early-planted trees establish root systems before peak rains, giving them better drought tolerance later. Insight guides training: emphasize optimal planting windows.
Mixed Planting Shows Better Pest Resistance
Farms with mixed species planting report fewer severe pest outbreaks than block plantations of single species. When pest problems occur, they affect only certain species in mixed systems, whilst monoculture blocks can be devastated. Photos show damage patterns. This ecological benefit wasn't predicted in project design but emerged clearly from farmer observations.
Boundary Planting Has Unexpectedly High Carbon Value
Farmers using boundary planting (trees along field edges) were initially considered lower-priority for carbon because they plant fewer trees per hectare. But their survival rates are consistently higher—trees on boundaries get more attention, better protection from livestock, more careful management. Higher survival partially offsets lower density. Plus boundary trees often grow larger (less competition) so per-tree carbon is higher. The model that assumed block planting would maximize carbon may need revision.
Biodiversity Return Is Non-Linear
Bird diversity in year one after planting shows little change from baseline. Year two shows modest increases—generalist species responding to any vegetation. Year three shows acceleration—specialist species appearing as trees create actual habitat structure. Audio recordings document this clearly: 5-8 species in degraded baseline, 12-15 species after three years in better-performing plantations. This pattern validates that agroforestry is creating ecological function, not just carbon storage.
Water Table Recovery Observed
Farmers in multiple districts report wells that were dry or very low during pre-planting baseline now showing improved water levels. This wasn't a primary project objective, but reforestation's effect on infiltration and water cycling is showing up in farmer observations. Water security is a major concern in semi-arid Telangana—if agroforestry improves groundwater recharge, that's a co-benefit worth documenting and promoting.
Economic Returns Drive Continued Engagement
Farmers who planted fruit species (mango, guava, pomegranate) alongside slower-growing timber maintain much higher engagement with monitoring surveys. They're seeing income from harvests, which motivates them to document everything carefully because they understand the link between good management and economic returns. Farmers who planted only timber species (20-year return timeline) show less consistent survey participation. This suggests diversified species mixes are important not just ecologically but for sustaining farmer engagement.
Traditional Knowledge Complements Technical Guidance
Older farmers frequently add observations in "other specify" fields that reveal traditional agroforestry knowledge. Specific intercropping patterns that improve tree growth. Seasonal timing for pruning based on traditional calendars. Companion species that tribal communities have used for generations. This knowledge wasn't in the technical planting guidelines but proves valuable when documented and shared with other farmers.
How This Changes Carbon Project Economics
The community monitoring approach solves a fundamental problem in smallholder carbon projects: verification costs that exceed credit revenue.
Traditional verification model:
-
External auditors visit farms
-
Measure sample plots across scattered landholdings
-
Interview farmers through translators
-
Analyse data off-site
-
Write verification reports
-
Return for next verification cycle
For 10,000 hectares across eight districts with thousands of individual smallholder plots, traditional verification might cost $50-100 per hectare per verification cycle. Over a 30-year project period with verification every 3-5 years, that's $300-500 per hectare in verification costs alone. With carbon credits generating perhaps $5-10 per tonne, and agroforestry sequestering maybe 5-10 tonnes per hectare per year, annual carbon revenue is $25-100 per hectare. Verification costs would consume 30-50% of total project revenue. That margin doesn't work for anyone.
Community monitoring model:
-
Farmers document continuously through phones (marginal cost near zero once system established)
-
Satellite data provides verification layer (paid service but scalable)
-
Field verification uses statistical sampling (small sample of total area)
-
Verification focuses on confirming farmer data, not generating primary data
-
Verification reports draw on months/years of documented observations
Verification costs drop to perhaps $10-20 per hectare per cycle because verification bodies aren't collecting primary data—they're auditing farmer-collected data. That 50-80% cost reduction makes the entire project economically viable.
More importantly, continuous farmer monitoring catches problems early. When survival rates drop, farmers report it in surveys. Project managers can respond—investigate cause, provide support, adjust management. With traditional verification happening every 3-5 years, problems aren't detected until potentially years after they occur, when intervention might be too late.
Early detection and response improves carbon outcomes. Better carbon outcomes mean more credits. More credits mean more revenue. More revenue sustains the project and provides better returns to farmers. Community monitoring doesn't just reduce costs—it improves fundamental project performance.
The Socio-Economic Piece: Why This Matters Beyond Carbon
Carbon credits are the financial mechanism, but the deeper transformation is socio-economic.
Land productivity restored. Marginal land that generated little or no income now produces fruit, timber, medicinal products, and carbon revenue. Farmers have economic reason to manage and protect land they might previously have abandoned or sold.
Income diversification reduces vulnerability. Instead of depending entirely on unreliable annual crops, farmers have perennial tree products generating staggered income across years and decades. This stability reduces poverty risk—one bad agricultural year doesn't destroy household economy when tree products provide baseline income.
Tribal communities gain forest resources. Tribal groups historically dependent on natural forests lost access as forests declined. Agroforestry on their own land recreates some forest products (medicinal plants, fruits, fuelwood, materials) they can harvest legally from their own holdings. This reduces both economic marginalization and conflict over access to remaining forest resources.
Women's economic participation increases. Fruit harvesting, processing, and marketing often involve women more than timber extraction does. Agroforestry species mixes that include fruit and medicinal plants create income opportunities for women within household economies.
Youth retention in rural areas. Agriculture alone struggles to keep young people in villages—returns are too low, work is too hard, urban opportunities seem better. Agroforestry combining carbon revenue, fruit income, and eventual timber sales creates viable rural livelihoods that might retain some youth who would otherwise migrate.
Ecosystem services benefit entire landscapes. Individual farmers plant trees on their land, but benefits extend beyond property boundaries. Improved water infiltration affects regional aquifers everyone depends on. Bird populations nesting in agroforestry areas disperse to surrounding farms, providing pest control services. Soil retained on tree-planted land doesn't erode into downstream reservoirs. The collective impact of thousands of farmers planting millions of trees shifts entire landscape function.
Scaling Beyond Telangana: The Replicable Model
The project is Telangana-specific, but the model applies anywhere smallholders have degraded land and limited monitoring resources.
Madhya Pradesh, Rajasthan, Gujarat face similar conditions—marginal agricultural land, degraded soils, smallholder poverty, tribal communities dependent on natural resources. The species mix would change (different rainfall, temperature, soils) but the agroforestry approach and community monitoring system transfer directly.
Nepal, Bangladesh, Sri Lanka have millions of smallholders with degraded land. The smartphone-based monitoring works anywhere farmers have basic phones and intermittent connectivity. The verification approach combining farmer data + satellite analysis + statistical sampling is portable.
Sub-Saharan Africa has massive potential for smallholder agroforestry—degraded land, tree planting suitability, community interest. The model shows how to make verification economics work at scale.
Latin America smallholder regions often have better connectivity and higher smartphone penetration than rural India, making the monitoring approach potentially easier to implement.
The fundamental insight transfers universally: community monitoring isn't a compromise when you can't afford proper verification—it's often better than traditional approaches because it's continuous, contextually informed, and intrinsically motivated. Farmers monitoring their own trees care more about accuracy than hired consultants doing required audits.

What Matters Most: Ownership
Large-scale tree planting initiatives have a terrible track record. Governments plant millions of trees that die within a year because nobody maintains them. Companies launch huge reforestation pledges that turn out to be mostly PR. Carbon projects claim massive sequestration that verification can't confirm.
The failures have a common pattern: communities that should be stewards don't have ownership, so they don't engage, so projects fail.
Project Developer gets ownership right. These are private smallholder farms. Farmers chose to join the project because agroforestry makes economic sense for them. They plant, manage, protect, harvest, and benefit from their trees. They monitor because they want to understand whether their investment is working, not because monitoring is required compliance.
The carbon credits are additional revenue to farmers, not the only revenue. Even if carbon markets disappeared tomorrow, farmers would still have fruit sales, eventual timber harvest, medicinal products. The agroforestry makes sense with or without carbon—but carbon revenue makes it financially attractive enough that marginal land gets planted instead of abandoned.
That intrinsic viability is what makes the model work. And the community monitoring is what proves the model is working, creating the documented evidence that turns tree growth into verified carbon credits that sustain the whole system.
When verification bodies arrive to sample plots across Telangana's eight districts, they're not facing communities who view them as threats or burdens. They're meeting farmers who've been documenting their own progress, who want to show what they've accomplished, who see verification as validation of work they're proud of.
That attitude shift—from monitored subjects to engaged documenters—changes everything. The trees grow better because people care. The data is more accurate because farmers want it to be. The verification is easier because there's genuine cooperation instead of suspicion.
And when those six million trees mature over coming decades, when degraded land becomes productive agroforestry, when rural Telangana communities have diversified income and restored ecosystems, when the documented evidence shows it all actually worked—that becomes the proof that smallholder agroforestry with community monitoring is viable at scale.
The phones in farmers' hands aren't just tools for data collection. They're instruments of transformation, documenting proof that marginal land and marginalized communities can become engines of carbon sequestration, biodiversity recovery, and rural prosperity. The documented evidence accumulated through thousands of farmers across tens of thousands of hectares proves it's possible.
Your Project
Could Work Like This
If you're working on a climate or environmental project that needs verified community data, you're probably facing similar questions to the ones in this case study.
How do you prove your project is working beyond just the technical metrics? What data do your funders need for carbon credits or ESG reporting? How do you catch problems on the ground before they undermine your results? Most importantly—how do you ensure the people affected by your project actually understand and benefit from it?
The difference between projects that succeed and ones that struggle often comes down to whether you're measuring the right things. Carbon calculations tell you about emissions. Community feedback tells you whether the intervention is actually working in practice. Education ensures that feedback is informed, not just reactive.
We've built the survey systems, education modules, and geotagged monitoring tools that made this project work. The same approach adapts to your context—different activities, different locations, different communities, different objectives.
What you get:
-
Custom education modules that teach participants about what they're monitoring and why it matters
-
Multilingual surveys designed for offline use in areas with limited connectivity
-
GPS-tagged responses that show location-specific patterns and problems
-
Anonymous feedback systems that protect privacy whilst collecting honest data
-
Verified data packages that meet carbon credit, MRV, and ESG reporting requirements
-
Operational insights that help you fix problems before they become failures
What your project needs:
-
A climate, environmental, or development initiative (planning stage or already operating)
-
Community members whose participation and feedback would strengthen your project
-
Funders or stakeholders who want proof of impact alongside technical metrics
The platform works whether you're monitoring 10 hectares or 10,000, whether you're in a remote village or an urban centre, whether your participants speak Spanish, English, French, Hindi, Indonesian, or Ukrainian.
Get Started
If you're working on a project that needs more than just technical data—where community engagement and verified feedback actually matter—let's talk about how this approach could work for you.
Or if you're not sure whether this approach fits your situation, send us a quick message describing what you're trying to achieve. We'll tell you honestly whether education-based community monitoring makes sense for your context.
Email us: nick@citizenclimate.net