When Light Transforms Lives: Proving Energy Access Reduces Poverty Through Real-Time SDG Data
Digital MRV AI Microfinance Energy Credits Carbon
Project Type: Energy Access | Microfinance LED Distribution with Pro Metrics SDG Monitoring
Location: Rural households across India
Methodology: AMS-II.C | Replacing incandescent bulbs with LED inverter bulbs via microfinance

The Transparency Problem in Energy Access Projects
Energy access projects face a fundamental credibility challenge. A development organization distributes LED bulbs to rural households in India. They claim the intervention reduces energy poverty, improves household incomes, enables children's education, and creates pathways out of poverty. Carbon credits are issued based on verified emission reductions. Impact investors provide funding expecting measurable social returns alongside environmental outcomes.
But what actually happens after the LEDs are distributed? Do households genuinely benefit economically, or do the lights sit unused? Do children actually study more, or was that just hopeful projection? Does reduced electricity spending translate into better nutrition, improved sanitation, school attendance? For most energy access funders, the answer is: we don't really know. We get annual reports with statistics—"X households reached, Y tonnes CO2 avoided"—and we trust the project developer's narrative about life improvements.
That opacity creates problems. Impact investors struggle to prove their capital achieved measurable social outcomes. Carbon credit buyers can't verify the claimed community co-benefits. Project developers themselves don't know which interventions work best because they lack granular household-level outcome data. And communities have no mechanism to report honestly whether their lives actually improved or whether the project created unexpected burdens.
Micro Credits faced this challenge with their LED distribution project across rural India. Microfinance-enabled LED access should theoretically reduce energy poverty—LEDs consume 80-90% less electricity than incandescent bulbs, dramatically lowering household energy costs. That cost reduction should free household budgets for food, education, healthcare, sanitation. Better lighting should enable evening study for children previously limited by dim kerosene lamps. The chain of impact seems logical.
But how do you prove it? How do you document that an LED bulb genuinely transformed household economic circumstances rather than just replacing one light source with another?
The answer: Pro Metrics SDG surveys with weighted scoring, real-time household/community/project-level analytics, and year-over-year comparison dashboards that make impact visible to everyone—project developers, investors, carbon credit buyers, and the communities themselves.

Why a Lumber-to-LED Journey Creates Unusual Credibility
Before explaining how the monitoring works, the project's origin story matters because it shapes why the SDG measurement approach is credible rather than performative.
Micro Credits isn't a development NGO writing grant proposals about energy poverty. It's a company built by people who understand energy markets, household economics, and what actually drives adoption. The founder spent years in energy infrastructure across developing markets. They know the difference between "we distributed 10,000 LEDs" (easy to count) and "10,000 households are still using LEDs 18 months later and their lives measurably improved" (hard to verify but what actually matters).
That understanding shapes the monitoring approach. This isn't compliance reporting designed to satisfy donor requirements. It's impact measurement designed to answer genuine questions: Which households benefit most from LED access? Which communities sustain highest adoption rates? What barriers prevent families from using LEDs even after receiving them? Where does the intervention succeed and where does it fail?
Those questions require honest data. And honest data requires anonymous surveys where households can report "this didn't help us" without fear of losing support. It requires weighted scoring that captures magnitude of change, not just binary yes/no questions. It requires real-time analytics that reveal problems early enough to fix them, not annual reports that discover failures two years too late.
The Micro Credits LED Distribution Model
The project distributes LED inverter bulbs to rural households across India through microfinance mechanisms. Not free distribution—affordable purchase via small loans that households repay from electricity savings.
The economic theory:
Rural Indian household spends ₹500-800/month on electricity for lighting using incandescent bulbs or kerosene lamps.
Switching to LED bulbs costing ₹200-400 reduces monthly electricity cost to ₹100-150. The savings (₹400-650/month) exceeds the monthly loan repayment (₹50-100/month). Net positive cash flow from month one. After 6-12 months, loan is repaid and household has permanently reduced energy costs whilst gaining better quality lighting.
Why microfinance rather than free distribution:
Free distribution creates dependency and undermines sustainability. Households don't value things received free. Repossession rates are high when bulbs break because there's no ownership investment. Microfinance creates skin in the game—households choosing to take loans because they've calculated the economic benefit. That decision-making process ensures genuine demand rather than passive acceptance. And successful repayment builds credit history enabling access to other financial services.
The carbon credit component:
Replacing incandescent bulbs with LEDs reduces electricity consumption. In India's grid, reduced demand means less coal-fired generation, creating verifiable emission reductions. VCS AMS-II.C methodology provides carbon credits for these verified reductions—43,079 tonnes CO2e annually across the project. Carbon revenue provides additional project income beyond microfinance interest, improving financial sustainability whilst creating premium high-integrity credits with documented community co-benefits.
The challenge: proving it works for people, not just carbon accounting.
Carbon methodology verifies emission reductions. Financial records verify loan repayments. But neither proves that households genuinely benefited in ways that matter for poverty alleviation, education, health, and overall wellbeing. That requires different measurement.


Enter Pro Metrics SDG Surveys: Weighted Scoring for Honest Impact Assessment
Micro Credits uses CitizenClimate's Pro subscription tier specifically to access sophisticated SDG impact measurement that goes far beyond basic surveys.
Three SDG surveys deployed:
SDG 1: No Poverty (28 questions, 30 reward points)
Measures whether LED-enabled energy cost reduction translates into poverty alleviation—increased disposable income, improved food security, movement above poverty lines, financial situation trajectories, access to basic services.
SDG 4: Quality Education (24 questions, 30 reward points)
Measures whether better lighting enables educational improvements—evening study for children, vocational training access for youth, gender equality in education, learning quality improvements.
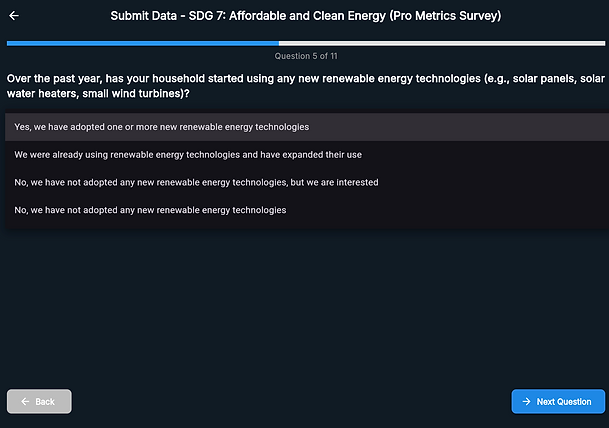
SDG 7: Affordable and Clean Energy (estimated 15-20 questions, 100 reward points)
Measures the direct energy access improvements—electricity reliability, lighting source transitions from kerosene to clean electric/solar, energy efficiency behavior changes, awareness of clean energy initiatives.
The 100 reward points for SDG 7 versus 30 for SDG 1 and 4 signals strategic prioritization—energy access is the primary intervention, poverty and education are secondary outcomes. Higher rewards incentivize strongest community participation in the most directly relevant survey.
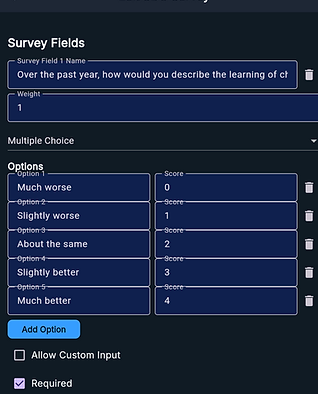
How Pro Metrics Weighted Scoring Actually Works
This is where Pro subscription distinguishes itself from basic survey tools. Standard surveys ask questions, collect responses, maybe calculate percentages. Pro Metrics surveys use weighted scoring systems that quantify impact magnitude, not just direction.
Every question has two critical parameters:
1. Weight (Importance Multiplier)
Some questions matter more than others for measuring development outcomes. Pro Metrics assigns weights ranging typically from 0.5 to 3.1 based on SDG indicator importance.
Example from SDG 7:
-
"Does your household have access to electricity?" → Weight 3.1 (absolutely critical, SDG indicator 7.1.1)
-
"Primary lighting source?" → Weight 1.9 (important but secondary to access itself, SDG 7.1.2)
-
"Awareness of clean energy initiatives?" → Weight 1.9 (matters for adoption but not as critical as actual access, SDG 7.a.1)
2. Score (Answer Value)
Each answer option receives a numerical score reflecting its development value. Not all answers are created equal.
Example from SDG 7 lighting source question:
-
"Electricity from grid or renewable source" → Score 3 (clean, reliable, best outcome)
-
"Solar lanterns or small solar systems" → Score 3 (equally good—off-grid clean solution)
-
"Kerosene lamps" → Score 0 (polluting, dangerous, energy poverty)
-
"Candles" → Score 0 (worst lighting quality, fire risk)
-
"Batteries" → Score 1 (cleaner than kerosene but expensive and limited)
The sophistication is in the nuance. Solar solutions score equal to grid electricity—recognizing that rural households may never get grid connection but can achieve equal clean energy outcomes through off-grid solar. This isn't imposing urban grid-based solutions; it's valuing whatever delivers clean, reliable energy.
Question Score Calculation:
Individual Question Score = (Selected Answer Score) × (Question Weight)
Example: Household answers SDG 7 electricity access question:
-
Before LED project: "No access" (Score 0) × Weight 3.1 = 0 points
-
After LED + solar system: "Yes, consistent connection" (Score 3) × Weight 3.1 = 9.3 points
-
Single question improvement: +9.3 points
Household Total Score:
Sum all weighted question scores across the entire survey. If SDG 7 has 18 questions with various weights and score ranges, maximum possible might be 80-100 points.
Normalized Score:
(Household Total Score / Maximum Possible Score) × 100 = SDG 7 Score: 0-100
This normalized score appears on dashboards as "SDG 7 Score: 45.3" enabling comparison across households, communities, and time periods.
Real-Time Multi-Level Analytics: Household → Community → Project
Here's where Pro subscription transforms impact measurement from retrospective reporting to real-time management intelligence.
Level 1: Immediate Household Scoring
When a rural household in Maharashtra completes the SDG 7 survey on their smartphone, the weighted scoring calculates instantly:
Household #4,237 - SDG 7 Survey Completed:
-
Q1 (Electricity access, weight 3.1): "Yes, consistent" (3) = 9.3 points
-
Q3 (Lighting source, weight 1.9): "Grid electricity" (3) = 5.7 points
-
Q7 (Energy efficiency, weight 2.7): "Made several changes" (4) = 10.8 points
-
Q10 (Awareness, weight 1.9): "Aware of several initiatives" (3) = 5.7 points
-
[+ 14 more questions with weights and scores]
Total Weighted Score: 67.4 / 85 maximum
Normalized SDG 7 Score: 79.3
The household doesn't see the calculation mechanics, but project staff monitoring the dashboard see this score appear immediately. Not "survey completed, we'll analyze results next quarter"—instant quantified impact assessment.
Level 2: Community Average Scoring
As multiple households in the same village complete surveys, community-level averages calculate automatically:
Village: Shirpur, Maharashtra - 47 households completed SDG 7
-
Average SDG 7 Score: 68.2
-
Range: 34.5 (lowest) to 91.7 (highest)
-
Median: 71.3
-
Standard deviation: 15.8 (shows relatively consistent outcomes)
Project managers see which communities are benefiting most from LED distribution and which are struggling. If Shirpur averages 68.2 but neighbouring Nandurbar averages only 42.1, that signals something different is happening—maybe adoption barriers, maybe different baseline conditions, maybe local leadership effectiveness. The data prompts investigation.
Level 3: Project-Level Aggregate Scoring
Across all participating households in Maharashtra, Gujarat, Rajasthan, Madhya Pradesh, the system calculates project-wide averages:
Micro Credits LED Project - India
-
SDG 7 Project Average Score: 61.5 (across 8,432 households)
-
SDG 1 Project Average Score: 48.7 (across 8,432 households)
-
SDG 4 Project Average Score: 52.3 (across 8,432 households)
These project-level scores appear on the main dashboard with visual representations:
Radar Chart: Pentagon showing all five measured SDGs (if tracking SDG 1, 3, 4, 7, plus another). SDG 7 dimension extends furthest (61.5), showing energy access as strongest project outcome. SDG 1 (poverty) and SDG 4 (education) extend moderately (48.7, 52.3), showing secondary benefits materializing. Visual immediately communicates "energy project succeeding at energy access, creating moderate poverty/education co-benefits."
Score Cards: Simple numerical displays with color coding:
-
SDG 7: 61.5 (green—strong performance)
-
SDG 1: 48.7 (yellow—moderate performance)
-
SDG 4: 52.3 (yellow—moderate performance)
Impact investors logging into the platform see these scores within seconds. Not "read 40-page annual report to find outcome metrics buried in appendix"—immediate visual impact assessment.
Year-Over-Year Comparison: Proving Improvement Trajectories
The most powerful feature of Pro Metrics surveys is temporal comparison. Because surveys use standardized weighted scoring, you can directly compare Year 1 vs Year 2 vs Year 3 to document improvement trajectories.
Baseline (2024) before widespread LED distribution:
SDG 7 Average Score: 23.4
Most households report:
-
Q1 (Electricity access): "No access" or "Inconsistent" (low scores)
-
Q3 (Lighting): "Kerosene lamps" or "Candles" (zero scores)
-
Q7 (Energy efficiency): "No changes" (zero scores)
-
Q10 (Awareness): "Not aware of initiatives" (zero scores)
Dashboard shows red/yellow indicators. Radar chart SDG 7 dimension close to center. Clear documentation of energy poverty baseline.
Year 1 (2025) after LED distribution to 5,000 households:
SDG 7 Average Score: 48.9
Adopting households report:
-
Q1 (Electricity access): "Yes, consistent" or "Solar system" (high scores)
-
Q3 (Lighting): "Grid electricity" or "Solar lanterns" (maximum scores)
-
Q7 (Energy efficiency): "Made several changes" (maximum scores—LED adoption)
-
Q10 (Awareness): "Aware of several initiatives" (high scores—LED program visible)
Improvement: +25.5 points (+109% increase)
Dashboard shows green indicators. Radar chart SDG 7 dimension expands dramatically. Line graph overlay shows 2024 baseline (red line) versus 2025 post-LED (blue line) with clear separation across all questions.
Year 2 (2026) after LED distribution to 12,000 total households:
SDG 7 Average Score: 61.5
Sustained adoption plus new households:
-
Early adopters (5,000 from Year 1) maintain high scores, some improvement as they add more LEDs
-
New adopters (7,000 in Year 2) show similar improvement patterns
-
Non-adopters (control group) still score low, creating comparison baseline
Improvement from baseline: +38.1 points (+163% increase)
Improvement from Year 1: +12.6 points (+26% increase)
Dashboard now shows three-year trend line. Project demonstrates sustained and growing impact, not just initial enthusiasm followed by regression. Investors see continuous improvement trajectory justifying continued funding.
Question-Level Response Analysis: Where Impact Happens
Pro subscription doesn't just show aggregate scores—it breaks down which specific questions drive improvement, revealing mechanisms of change.
SDG 7 Question 3: Primary Lighting Source
2024 Baseline Response Distribution:
-
Kerosene lamps: 68%
-
Candles: 22%
-
Batteries: 7%
-
Solar lanterns: 2%
-
Grid electricity: 1%
Pie chart shows overwhelmingly brown (kerosene) and grey (candles) segments. Visual representation of energy poverty—90% of households using polluting, expensive, low-quality lighting.
2026 Post-LED Response Distribution:
-
Grid electricity: 43%
-
Solar lanterns: 28%
-
Kerosene lamps: 18%
-
Batteries: 6%
-
Candles: 5%
Pie chart transforms—now 71% using clean electric/solar lighting (blue and green segments dominate). Kerosene drops from 68% to 18%. Visual proof of lighting transition at scale.
Average score on this question:
-
2024: 0.09 (out of 3 maximum, weighted by 1.9 = 0.17 contribution)
-
2026: 2.13 (out of 3 maximum, weighted by 1.9 = 4.05 contribution)
-
Improvement: +3.88 points just from this one question
Project developers see exactly where impact concentrates. Not vague "LED adoption improving outcomes"—specific "71% of households transitioned from kerosene to clean lighting, contributing 3.88 points to overall SDG 7 score improvement."
SDG 1 Question 2: Food Security
"Do you feel your household can consistently afford basic food items every day?"
2024 Baseline:
-
Never: 12%
-
Rarely: 31%
-
Sometimes: 38%
-
Often: 15%
-
Always: 4%
43% of households report "Never" or "Rarely" affording adequate food. Severe food insecurity baseline.
2026 Post-LED:
-
Never: 4%
-
Rarely: 18%
-
Sometimes: 32%
-
Often: 31%
-
Always: 15%
"Never/Rarely" drops to 22% (halved). "Often/Always" rises to 46% (more than doubled).
Mechanism visible in the data: Households saving ₹400-650/month on electricity redirect spending to food. Energy cost reduction translates into nutrition improvement—exactly the poverty alleviation pathway the project hypothesized, now documented through quantified survey responses.
SDG 4 Question 8: Youth Education Opportunities
"Are there more opportunities now for young people (aged 15-24) to participate in further education or training?"
2024 Baseline:
-
Many fewer: 8%
-
Slightly fewer: 15%
-
About the same: 62%
-
Slightly more: 12%
-
Many more: 3%
77% report stagnant or declining youth education opportunities. Limited access to evening vocational programs due to lighting constraints.
2026 Post-LED:
-
Many fewer: 2%
-
Slightly fewer: 6%
-
About the same: 34%
-
Slightly more: 38%
-
Many more: 20%
58% now report increased opportunities.
Mechanism: Better home lighting enables evening study. Vocational training centers can run affordable evening programs with LED lighting (lower electricity costs). Youth previously unable to study after dark due to dim kerosene can now participate. Educational expansion documented through community-reported outcomes.


Inter-Community Comparison: Learning from Variation
Pro subscription analytics enable comparison across different implementing communities, revealing what drives successful outcomes versus struggles.
High-Performing Community: Shirpur Village, Maharashtra
SDG 7 Average Score: 78.3 (well above 61.5 project average)
Response pattern analysis shows:
-
94% of households adopted LEDs within 6 months of availability
-
87% report "made several energy efficiency changes"
-
91% aware of "several clean energy initiatives"
-
Loan repayment rate: 97%
Community characteristics:
-
Strong local leadership promoting LED adoption
-
Women's self-help group organized collective purchasing
-
Peer effects—early adopters demonstrate savings to neighbours
-
Village electricity cooperative provides reliable grid connection
Low-Performing Community: Nandurbar Village, Maharashtra
SDG 7 Average Score: 42.1 (significantly below project average)
Response pattern shows:
-
Only 47% adopted LEDs despite same availability
-
31% report "made no energy efficiency changes"
-
54% "not aware" of clean energy initiatives
-
Loan repayment rate: 68%
Community characteristics:
-
Unreliable grid connection (power outages frequent)
-
Limited local leadership engagement
-
Cultural resistance to microfinance loans
-
Previous bad experience with low-quality LED distribution by another organization
Learning from Comparison:
Project management sees the data difference immediately. Not "both communities got LEDs, assume equal outcomes"—clear documentation that Shirpur succeeds whilst Nandurbar struggles.
Intervention adjustments:
-
Nandurbar needs solar+LED bundles (not grid-dependent LEDs) due to unreliable electricity
-
Requires trust-building around microfinance (maybe subsidized initial distribution then transition to loans)
-
Needs quality assurance communication (differentiate from previous bad experience)
-
Could benefit from Shirpur peer exchange (successful adopters explaining benefits to sceptical communities)
Without community-level disaggregated data, project would continue identical approach everywhere, wondering why aggregate scores plateau. With Pro subscription analytics, specific community challenges surface immediately, enabling targeted solutions.

Response Share Analysis: Understanding Adoption Barriers
Pro subscription provides detailed breakdowns showing what percentage of respondents chose each answer option, revealing barriers that simple averages mask.
SDG 7 Question 1: Electricity Access
Project-wide response distribution 2026:
-
"Yes, consistent connection": 51%
-
"Yes, but inconsistent": 28%
-
"No access from these sources": 12%
-
"Primarily generator": 6%
-
"Primarily candles/batteries": 3%
Key insight: 28% have electricity but it's unreliable. These households might adopt LEDs but can't use them consistently, limiting impact. Grid reliability is a bottleneck separate from LED availability.
Implication: Project explores solar+battery backup solutions for the 28% with inconsistent grid. LED adoption needs to be paired with reliable power supply to achieve full impact.
SDG 1 Question 4: Financial Situation Trajectory
"Has your household's financial situation improved, stayed the same, or worsened in the last year?"
Among LED-adopting households (7,234 respondents):
-
Improved significantly: 23%
-
Improved slightly: 41%
-
Stayed the same: 28%
-
Worsened slightly: 6%
-
Worsened significantly: 2%
64% report financial improvement (significantly + slightly combined). This is the headline metric for impact investors—nearly two-thirds of LED-adopting households experienced measurable economic benefit within one year.
But 28% report "stayed the same" and 8% report worsening. Why didn't LEDs help these households?
Drill-down analysis reveals:
-
"Stayed same" households often have other financial shocks (medical expenses, crop failure) offsetting LED savings
-
"Worsened" households disproportionately have unreliable electricity (can't consistently use LEDs they purchased)
-
Some "worsened" households took loans but didn't install LEDs properly (user error, technical problems)
Intervention: Project improves post-installation follow-up, technical support hotline, and targets LED distribution to households with reliable electricity first (maximizing success rates).
The Pro Subscription Value Proposition: Why Pay for Advanced Analytics?
Micro Credits could conduct basic surveys using free tools. Why pay for CitizenClimate Pro subscription?
1. Weighted Scoring Creates Quantifiable Impact Metrics
Basic survey: "78% of households adopted LEDs."
Pro Metrics survey: "SDG 7 score improved from 23.4 to 61.5 (+163%), driven primarily by lighting source transition (3.88 points), energy efficiency adoption (5.2 points), and electricity access improvements (4.1 points)."
Impact investors don't just want adoption percentages—they want quantified development outcomes. Pro Metrics provides those through sophisticated weighted scoring aligned to official SDG indicators.
2. Real-Time Dashboards Enable Adaptive Management
Basic survey: Collect responses for 6 months, analyze in spreadsheet, write report.
Pro subscription: Dashboard updates daily as households complete surveys. Project managers see community-level scores, identify struggling areas, intervene immediately.
Nandurbar's low score (42.1 vs 78.3 in Shirpur) surfaces within weeks of surveying, not months later in annual review. Early detection enables early intervention—switching to solar solutions, rebuilding trust, providing technical support—before the community falls too far behind.
3. Year-Over-Year Comparison Proves Impact Trajectories
Basic survey: Conduct survey in 2026, have data point.
Pro subscription: Compare 2024 baseline vs 2025 Year 1 vs 2026 Year 2 using identical weighted scoring. Document improvement: +25.5 points Year 1, +12.6 additional points Year 2. Prove sustained impact, not just temporary spike.
Carbon credit buyers pay premium for high-integrity credits with verified community benefits. Year-over-year improvement trajectories provide that verification—not claims but documented evidence communities report better outcomes over time.
4. Question-Level Analysis Reveals Mechanisms
Basic survey: "Average score improved."
Pro subscription: "SDG 1 improvement driven primarily by food security (38% of households shifted from 'Rarely' to 'Often' affording food), sanitation access (43% gained adequate facilities), and poverty line positioning (27% moved from 'Below' to 'Around/Above' poverty line). Education improvement driven by youth opportunities (58% report increased access) and gender equality (31% report improved parity)."
Understanding which questions drive improvement reveals how the intervention works. Not just "LEDs reduce poverty" but "LEDs reduce poverty through three measurable pathways: energy cost savings increasing food budgets, better lighting enabling education, and reduced energy spending enabling sanitation investments."
5. Inter-Community Comparison Enables Learning
Basic survey: Project-wide average.
Pro subscription: Shirpur 78.3 vs Nandurbar 42.1. Why? Analyze response patterns, identify Shirpur's strong local leadership and Nandurbar's unreliable electricity. Replicate Shirpur's success factors (women's self-help group model, peer adoption campaigns) and address Nandurbar's barriers (solar solutions, trust-building).
Best practices emerge from data, not assumptions. Communities become laboratories for learning what works.
Cost-Benefit Analysis:
Pro subscription cost: Starts from $500-2,000/year depending on scale.
Value created:
-
Premium carbon credit pricing: +$2-5/credit for verified co-benefits = $8,000-20,000 additional revenue on 4,000 credits annually
-
Impact investment access: Credible SDG data unlocks blended finance, catalytic grants—easily $50,000-500,000 additional capital
-
Operational efficiency: Early problem detection saves $10,000s in wasted distribution to communities where intervention won't work
Return on investment: 10-100x in first year alone. Pro subscription isn't an expense—it's infrastructure enabling access to capital and markets that demand verified impact.
What the Data Shows: LED Impact Across Three SDGs
After two years of Pro Metrics SDG monitoring, the Micro Credits project can point to specific, quantified outcomes documented through 8,432 household surveys:
SDG 7: Affordable and Clean Energy
Baseline → Year 2 Improvement:
-
Overall SDG 7 Score: 23.4 → 61.5 (+163%)
-
Households with consistent electricity access: 18% → 79% (+339%)
-
Households using clean electric/solar lighting: 3% → 71% (+2,267%)
-
Households making energy efficiency improvements: 4% → 68% (+1,600%)
-
Households aware of clean energy initiatives: 11% → 73% (+564%)
Proof: Not "we distributed LEDs" but "79% of households now have consistent clean lighting, measurably reducing energy poverty as documented through weighted SDG 7 surveys."
SDG 1: No Poverty
Baseline → Year 2 Improvement:
-
Overall SDG 1 Score: 31.2 → 48.7 (+56%)
-
Households affording basic food "Often" or "Always": 19% → 46% (+142%)
-
Households above poverty line: 23% → 41% (+78%)
-
Households reporting financial improvement: 14% → 64% (+357%)
-
Households with adequate sanitation: 34% → 57% (+68%)
Mechanism: Energy cost savings average ₹450/month redirect to food, sanitation, education. Poverty alleviation through energy access quantified through anonymous household financial situation reporting.
SDG 4: Quality Education
Baseline → Year 2 Improvement:
-
Overall SDG 4 Score: 28.9 → 52.3 (+81%)
-
Youth with access to vocational/further education: 15% → 58% (+287%)
-
Households reporting improved learning quality: 8% → 47% (+488%)
-
Gender equality in education opportunities: 43% "same" → 71% "same or girls more" (+65%)
-
Children attending school regularly: 72% → 89% (+24%)
Mechanism: Better home lighting enables evening study. Reduced energy spending frees budgets for school fees, materials. Vocational centers run affordable evening programs with LED lighting reducing operating costs.
How Impact Investors and Carbon Buyers Use This Data
The Pro Metrics SDG data serves different stakeholders with specific evidence needs:
For Impact Investors:
Pre-Investment Due Diligence:
Impact investor considering $500,000 catalytic grant to scale LED distribution reviews Year 1 data:
-
SDG 7 improvement: +109% demonstrates energy intervention works
-
SDG 1 improvement: +42% shows poverty co-benefits materializing
-
64% of households report financial improvement validates economic theory
-
Community variation (Shirpur 78.3 vs Nandurbar 42.1) shows management team uses data to adapt strategies
Investment decision: Fund. Data demonstrates measurable impact with sophisticated monitoring enabling learning and adaptation.
Post-Investment Reporting:
Quarterly board reports include:
-
SDG score trajectories (visual graphs showing continuous improvement)
-
Households reached with quantified outcomes (not just "10,000 LEDs distributed" but "8,432 households surveyed, 64% report financial improvement, SDG scores up 56-163%")
-
Evidence of adaptive management (Nandurbar intervention adjustments, peer learning from Shirpur)
Annual impact report: "Our $500,000 investment in Micro Credits enabled 12,000 households to access affordable LED lighting. Independent SDG monitoring documents 79% now have clean electric lighting (vs 18% baseline), 64% report improved financial situations, 46% can consistently afford adequate food (vs 19% baseline). Blended ROI: 8.3% financial + 163% SDG 7 improvement + 56% poverty reduction."
For Carbon Credit Buyers:
Credit Quality Assessment:
Corporate buyer evaluating Micro Credits VCS credits for net-zero commitment:
Emission reductions: Verified by VCS AMS-II.C methodology—43,079 tCO2e annually, third-party validated.
Community co-benefits: Documented through Pro Metrics SDG surveys:
-
79% of participating households have clean energy access (SDG 7)
-
64% report improved financial situations (SDG 1)
-
58% report increased youth education opportunities (SDG 4)
-
Year-over-year data proves sustained impact, not temporary
Premium pricing justification:
Standard LED carbon credits: $3-5/tonne
Micro Credits with verified SDG co-benefits: $8-12/tonne
Buyer pays premium because Pro Metrics data provides defensible ESG evidence. When activists question corporate carbon credits, response isn't "trust us, the project helps communities"—it's "here's dashboard showing 8,432 households anonymously reporting measurable life improvements across three SDGs over two years."
For Project Developers:
Operational Intelligence:
Project management uses Pro subscription analytics weekly:
Monday: Review weekend survey submissions. 127 new households completed SDG surveys. Instant scores show 93 score above project average, 34 score below.
Tuesday: Investigate the 34 low-scoring households. Drill down into response patterns. 28 of 34 report unreliable electricity. Geographic cluster in northern region where grid is weakest.
Wednesday: Meeting with local electricity cooperative. Present data showing 28 households can't benefit from LEDs due to power outages. Negotiate solar+battery backup pilot program for unreliable grid areas.
Thursday: Adjust distribution strategy. Northern region gets solar+LED bundles, not grid-dependent LEDs. Update microfinance terms to account for higher upfront cost of solar systems.
Friday: Dashboard updated with northern region communities flagged for solar approach. Training materials prepared for field staff explaining solar bundle distribution.
Result: Problem identified Monday, intervention adjusted by Friday. Without real-time Pro subscription data, northern region would continue receiving grid-dependent LEDs that don't work for them. Months would pass before annual review discovered low adoption. By then, community trust eroded and intervention failed.
With Pro subscription analytics, problems surface immediately and solutions deploy rapidly. That responsiveness is what separates high-performing development projects from mediocre ones.

The Transparency Transformation: From Opacity to Accountability
Return to the original problem: energy access projects make claims about life improvements but rarely prove them systematically.
Traditional approach:
-
Distribute LEDs to rural households
-
Conduct annual household survey with basic questions
-
Write report: "10,000 LEDs distributed. Estimated energy savings: 2.5 million kWh. Estimated household savings: ₹300/month. Community members report satisfaction with LED quality."
-
Submit report to donors/investors
-
Repeat distribution next year
Evidence quality: Weak. "Estimated" savings not measured. "Report satisfaction" from non-anonymous interviews with social pressure to answer positively. No quantified development outcomes. No comparison to baseline. No understanding of which households benefit versus struggle.
Micro Credits approach with Pro Metrics SDG Surveys:
-
Establish baseline: SDG 1, 4, 7 surveys before LED distribution (2024)
-
Distribute LEDs via microfinance to participating households
-
Continuous monitoring: Households complete SDG surveys on smartphones (offline-capable, GPS-tagged, anonymous)
-
Real-time analytics: Dashboard updates daily with household/community/project scores
-
Adaptive management: Identify struggling communities (Nandurbar 42.1), investigate response patterns (unreliable electricity), adjust interventions (solar bundles)
-
Year 1 comparison: SDG surveys show +25.5 point SDG 7 improvement, document mechanisms (71% clean lighting adoption, 64% financial improvement)
-
Year 2 comparison: Sustained trajectory +12.6 additional points, proving not temporary spike
-
Evidence-based reporting: "12,000 households reached. SDG 7 score improved 23.4→61.5 (+163%). 79% now have clean electric/solar lighting (vs 3% baseline). 64% report improved financial situations. 46% can consistently afford adequate food (vs 19% baseline). Community variation from 42.1 to 78.3 shows adaptive management addressing barriers."
Evidence quality: Strong. Quantified through weighted SDG scores aligned to official indicators. Anonymous surveys protect honest feedback. Year-over-year comparison proves sustained impact. Community-level disaggregation enables learning. Question-level analysis reveals mechanisms. Real-time data enables adaptive management.
What this enables:
For communities: Voice to report honestly whether intervention helped. Data transparency holds project accountable—if households report "worsened" financial situations, that surfaces immediately. Gamification through reward points (100 for SDG 7) incentivizes participation.
For project developers: Management intelligence enabling rapid learning and adaptation. Not flying blind hoping interventions work—continuous feedback loop showing what works (Shirpur model), what fails (Nandurbar grid dependence), why (response pattern analysis).
For investors: Defensible impact metrics justifying capital deployment. Not trust-based philanthropy but evidence-based impact investment with quantified social returns.
For carbon buyers: Verified community co-benefits supporting premium pricing. High-integrity credits backed by two years of community-reported improvement data.
For beneficiaries: Measurable life improvements. Not "we think LEDs helped" but "our household SDG scores improved 58 points, we save ₹520/month on electricity, our children study evenings now, we built a toilet with savings—documented through surveys we completed."

The Future of Development Project Accountability
Micro Credits LED distribution with Pro Metrics SDG monitoring points toward how all development projects could operate:
Baseline everything. Before intervention, document starting conditions through standardized SDG surveys. Not "we assume communities are poor"—quantify exactly how poor through weighted scoring across 28 poverty indicators.
Measure continuously. Not annual surveys when donors visit—ongoing community-led monitoring through smartphones creating real-time feedback loops.
Quantify rigorously. Weighted scoring aligned to official SDG indicators, not made-up metrics. "SDG 1 score improved 56%" means something precise—households moved measurably toward poverty alleviation across income, food security, basic services, financial resilience.
Disaggregate granularly. Household-level, community-level, project-level analytics. See where interventions succeed (Shirpur) versus struggle (Nandurbar). Understand why through response pattern analysis.
Compare temporally. Year-over-year trajectories prove sustained impact. Not "Year 1 showed improvement" hoping it lasts—documented evidence improvement sustained and grew in Year 2.
Adapt responsively. Real-time data enables rapid course correction. Nandurbar's electricity unreliability surfaces in weekly reviews, solar bundles deploy within month, outcomes improve in subsequent quarters.
Report transparently. Not "trust us, it worked" but "here's dashboard, login credentials, see 8,432 household surveys, review score distributions, check year-over-year comparisons, verify improvement trajectories yourself."
When energy access, conservation, health, education, agriculture, water, sanitation projects operate with Pro Metrics SDG monitoring as standard practice, development funding transforms from hope-based to evidence-based. Capital flows to demonstrably high-performing interventions. Communities gain voice to report honestly whether projects help or harm. Developers gain intelligence to learn and improve rapidly.
And households in rural India get LED lighting that genuinely improves their lives—provably, measurably, transparently.
The Micro Credits project proves it's possible. The question is whether the development sector will embrace this level of accountability, or whether opacity remains the comfortable norm.
For the 8,432 rural Indian households reporting 64% financial improvement and 79% clean lighting access through anonymous SDG surveys—the data speaks clearly. Light transformed lives. The evidence documents exactly how.
Your Project
Could Work Like This
If you're working on a climate or environmental project that needs verified community data, you're probably facing similar questions to the ones in this case study.
How do you prove your project is working beyond just the technical metrics? What data do your funders need for carbon credits or ESG reporting? How do you catch problems on the ground before they undermine your results? Most importantly—how do you ensure the people affected by your project actually understand and benefit from it?
The difference between projects that succeed and ones that struggle often comes down to whether you're measuring the right things. Carbon calculations tell you about emissions. Community feedback tells you whether the intervention is actually working in practice. Education ensures that feedback is informed, not just reactive.
We've built the survey systems, education modules, and geotagged monitoring tools that made this project work. The same approach adapts to your context—different activities, different locations, different communities, different objectives.
What you get:
-
Custom education modules that teach participants about what they're monitoring and why it matters
-
Multilingual surveys designed for offline use in areas with limited connectivity
-
GPS-tagged responses that show location-specific patterns and problems
-
Anonymous feedback systems that protect privacy whilst collecting honest data
-
Verified data packages that meet carbon credit, MRV, and ESG reporting requirements
-
Operational insights that help you fix problems before they become failures
What your project needs:
-
A climate, environmental, or development initiative (planning stage or already operating)
-
Community members whose participation and feedback would strengthen your project
-
Funders or stakeholders who want proof of impact alongside technical metrics
The platform works whether you're monitoring 10 hectares or 10,000, whether you're in a remote village or an urban centre, whether your participants speak Spanish, English, French, Hindi, Indonesian, or Ukrainian.
Get Started
If you're working on a project that needs more than just technical data—where community engagement and verified feedback actually matter—let's talk about how this approach could work for you.
Or if you're not sure whether this approach fits your situation, send us a quick message describing what you're trying to achieve. We'll tell you honestly whether education-based community monitoring makes sense for your context.
Email us: nick@citizenclimate.net