Adopt Your Own Amazon Forest and Watch Communities Protect It: When Conservation Becomes Transparent Investment
Digital MRV AI REDD+ Carbon
Project Type: Adoptable Forest Conservation with Live Community Monitoring
Location: Bolivia Amazon region
Methodology: Corporate/individual forest adoption with community-verified protection via real-time digital MRV dashboard including SDG health outcomes

The Problem with Conservation You Can't See
Conservation has an opacity problem. Corporations donate to rainforest protection. Individuals sponsor endangered species. Foundations fund biodiversity projects. Money flows from the Global North to conservation initiatives in the Global South, generating tax deductions, ESG credits, and good PR along the way.
But what actually happens after the cheque clears? The forest you sponsored—is it still there? The community you're supporting—are they genuinely benefiting? The biodiversity you're protecting—is it recovering or declining? For most conservation funders, the answer is: we don't really know. We get annual reports with statistics, maybe some photos, hopefully an impact narrative. We trust the NGO or project developer is doing what they promised. But we can't see it.
That opacity creates problems. Sceptical donors wonder if their money is making a difference. Corporate sustainability teams struggle to prove their conservation investments are genuine. Employees and customers question whether company forest protection claims are greenwashing. And when scandals emerge—conservation projects that displaced communities, protected forests that weren't actually threatened, biodiversity reserves that existed only on paper—the entire conservation funding model loses credibility.
The Bolivian Amazon faces this opacity acutely. International conservation funding flows into Bolivia. Some projects work brilliantly. Others fail quietly. Funders back in Europe or North America rarely know which category their investment falls into until years later, if ever.
Massimo Bottura saw an alternative model. What if conservation funders could adopt specific parcels of Amazon forest—not abstract hectares somewhere in Bolivia, but actual named reserves they could visit virtually? What if communities living in those forests documented protection activities through their phones—reporting illegal logging attempts, photographing wildlife, tracking tree health, measuring how conservation affects their water access and health—and funders could see that data in real-time on a dashboard? What if forest adoption worked like sponsoring a child, where you get updates showing your specific investment is making a tangible difference, except at landscape scale?
That's the model being piloted in Bolivia's Amazon region: adoptable Amazon parcels with community-verified protection visible through digital monitoring.

Why a Lumber Industry Veteran Is Protecting Forests
Before explaining how adoption works, the project's origin story matters because it explains why this approach is viable when others aren't.
Massimo Bottura isn't a career conservationist. He spent 25 years in Bolivia's lumber industry. He knows the Amazon timber trade intimately—the economics that drive logging, the supply chains that move wood from remote forests to international markets, the communities whose livelihoods depend on forest products, the pressures that turn sustainable harvesting into destructive extraction.
That insider knowledge creates unusual advantages for forest protection:
He knows how deforestation actually happens. Not theoretically from academic papers, but practically from decades in the business. He knows which roads enable logging access. Which communities are vulnerable to offers from illegal loggers. What economic pressures push sustainable practices toward unsustainable ones. What enforcement gaps illegal operators exploit. When you're trying to prevent deforestation, understanding precisely how it occurs is invaluable.
Communities trust him. Thirty years of presence in Bolivia, much of it working directly with indigenous communities, built relationships that conservation NGOs arriving from abroad can't replicate quickly. He's not an outsider promising things. He's someone communities have known for decades, who speaks their language, understands their circumstances, and has delivered on commitments before. That trust is the foundation that makes community-based monitoring possible.
He has a foundation with 36 indigenous nations. Before designing any carbon project, before talking about forest adoption, Massimo established a non-profit foundation with representatives from 36 recognized indigenous nations across Bolivia. This wasn't a consultation process for a predetermined project—it was building genuine partnership infrastructure first. When the conservation project was designed, it happened through that foundation, not imposed on it.
He understands what makes conservation economically viable. Lumber industry experience means understanding forest economics. He knows communities need income to choose conservation over extraction. He knows what financial mechanisms actually work on the ground versus what sounds good in funding proposals. The adoption model reflects economic realism, not just environmental idealism.
The counterintuitive angle—lumber industry veteran protecting forests—is the credibility foundation. When someone who knows how to profit from forest destruction chooses to prevent it instead, and has the relationships to make prevention work, that's worth paying attention to.
How Forest Adoption Actually Works
The Amazon Recovery Project offers corporate and individual funders the opportunity to adopt specific parcels of Bolivian Amazon rainforest. Not contribute to a pooled conservation fund—adopt actual named reserves with defined boundaries, documented communities protecting them, and visible monitoring data.
Three adoption models, each renewable for 10 years:
Solution 1: Private National Reserve
Adopt up to 5,000 hectares of rainforest.
The corporation or foundation names the adopted parcel —actual geographic areas with coordinates, boundaries, and communities managing them. This isn't symbolic naming of a few trees. It's substantial landscape-scale adoption with branding rights.
Marketing asset creation. The adopted reserve becomes a genuine corporate sustainability asset. Companies can feature it prominently in ESG reports, sustainability communications, employee engagement campaigns. It's not "we bought carbon offsets somewhere"—it's "we protect 2,000 hectares of named Amazon rainforest in partnership with indigenous communities, and here's the live data showing it's working for both forests and people."
Transparency through monitoring. Adopted parcels have associated monitoring data visible to adopters. Community members document protection activities, biodiversity observations, health outcomes, and forest health indicators through the CitizenClimate platform. That data flows to a dashboard accessible to the adopting corporation. Monthly updates showing what's happening in your reserve—including whether communities are experiencing improved water access, better sanitation, and enhanced wellbeing—not annual reports summarizing regional aggregates.
10-year renewable commitment. Forest protection isn't a one-time action—it requires sustained commitment. The 10-year renewal structure aligns conservation funding with ecological reality. It's long enough to enable genuine landscape management, short enough that performance can be evaluated and renewed based on documented outcomes.
Solution 2: Customer-Involved Adoption
Similar to Solution 1 but extends participation to end customers.
Some corporations want employees or customers to feel connection to conservation investments. This model enables that by creating accessible interfaces for broader participation.
Virtual forest visits. A Google Street View-like platform allows anyone to virtually explore the adopted Amazon parcel. Navigate trails, see forest canopy, view rivers and clearings. Not just satellite imagery—ground-level immersive views that create emotional connection to the place being protected.
Community stories and updates. End customers see not just forest imagery but hear from communities protecting it. Updates from monitoring activities, stories about wildlife observations, explanations of traditional forest management practices, insights into how adoption revenue benefits community livelihoods and health outcomes like improved water access and sanitation.
Employee/customer engagement campaigns. Companies can build internal engagement around their Amazon reserve. Challenges to identify species from monitoring photos, competitions to name newly documented biodiversity, employee missions to review monitoring data and write reports. Conservation becomes participatory, not just philanthropic.
Educational content integration. The virtual platform includes educational modules about Amazon ecosystems, indigenous forest stewardship, climate change and deforestation, biodiversity importance, and how healthy forests support community health through clean water and ecosystem services.
This model works particularly well for consumer-facing brands wanting to differentiate on sustainability, or for companies with strong internal sustainability culture wanting tangible employee engagement.
Solution 3: Tokenized Adoption
Adoption represented by blockchain-based tokens.
This model creates investment vehicles that combine conservation impact with potential financial value.
Blockchain transparency. Each adopted parcel is represented by tokens on blockchain. Ownership is transparent, verifiable, and tradeable. The token represents the conservation adoption supporting specific forest protection with documented ecological and community health benefits.
Investment vehicle for conservation. This creates something rare in conservation finance—a liquid investment instrument. An adopter who commits to 10 years but wants to exit after 5 years can potentially sell their tokenized adoption to another party. The forest continues protected (because community agreements and monitoring persist), but the financial instrument transfers. This liquidity could enable conservation funding at scales traditionally difficult to achieve.
Secondary market potential. As impact investment markets mature and high-integrity conservation with verified community benefits (including health outcomes) command premium valuations, tokenized adoptions from projects with continuous community monitoring could appreciate in value. Early adopters supporting high-quality forest protection might see financial returns alongside conservation impact.
The tokenization model appeals to impact investors, family offices, and corporate treasuries that want measurable conservation outcomes plus potential financial returns, rather than pure philanthropy.
The 6-Month Pilot: Proving the Model Works
Theory is one thing. Documented evidence is another. The project is conducting a 6-month pilot integrating CitizenClimate as the digital MRV and community engagement layer specifically to prove the adoption model works at scale.
Pilot scope:
-
Indigenous communities in Bolivian Amazon region
-
Multiple adoptable parcels
-
Comprehensive monitoring covering tree survival/growth, biodiversity, health outcomes, and livelihood impacts
-
Live dashboard accessible to pilot adopters and project investors
Key deliverables:
Community onboarding and training. Communities receive training on using CitizenClimate platform for forest monitoring. Not external consultants visiting periodically—community members themselves becoming forest monitors with digital tools.
Training covers:
-
Smartphone basics for those less tech-literate
-
Survey completion for different monitoring types (SDG health, biodiversity, tree health, livelihood)
-
Photo and video documentation best practices
-
Audio recording for bird and wildlife documentation
-
GPS tagging to link observations to specific locations
-
Offline functionality (internet connectivity is limited in remote Amazon communities)
Field data collection at scale. Once trained, community monitors document forest protection activities across multiple categories that together prove conservation works for both forests and people.

The Surveys: Proving Conservation Benefits Communities
The monitoring system combines multiple survey types that together create comprehensive evidence of whether conservation is genuinely improving community wellbeing alongside protecting ecosystems.
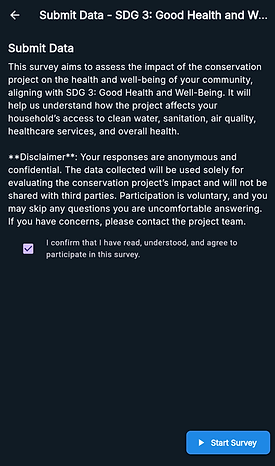
SDG 3: Good Health and Well-Being Survey — The Health Impact Layer
This 17-question survey directly addresses something conservation projects rarely document: whether forest protection correlates with improved community health outcomes.
Introduction: "This survey aims to assess the impact of the conservation project on the health and well-being of your community, aligning with SDG 3: Good Health and Well-Being. It will help us understand how the project affects your household's access to clean water, sanitation, air quality, healthcare services, and overall health."
Anonymity and consent: "Your responses are anonymous and confidential. The data collected will be used solely for evaluating the conservation project's impact and will not be shared with third parties. Participation is voluntary, and you may skip any questions you are uncomfortable answering. If you have concerns, please contact the project team."
The anonymity matters critically here. Health and sanitation questions can be sensitive. Communities might feel embarrassed reporting open defecation or unsafe water sources. Anonymous surveys at scale produce honest baselines that project-facilitated interviews wouldn't capture.
Water access baseline and changes:
Question 3 of 17: What is your main source of drinking water?
Multiple selection covering the full spectrum of water access:
-
Piped water into dwelling, yard, or plot
-
Public tap or standpipe
-
Tube well or borehole
-
Protected dug well
-
Protected spring
-
Rainwater
-
Bottled water
-
Unprotected well
-
Unprotected spring
-
Surface water (river, dam, lake, pond, stream, canal)
-
Other (please specify)
This granular categorization follows WHO/UNICEF Joint Monitoring Programme standards for water access. Different water sources carry different health risks. Surface water and unprotected sources correlate with waterborne diseases. Piped water suggests infrastructure investment. The baseline establishes what communities start with.
Question 4 of 17: Has the quality or availability of your drinking water changed in the past year?
Four options:
-
Improved
-
Stayed the same
-
Worsened
-
Don't know
This temporal tracking transforms baseline data into impact measurement. If 68% of households report improved water quality or availability after project implementation, that's documented evidence forest protection correlates with health benefits. If responses show "worsened," that flags problems requiring investigation—perhaps conservation restrictions affected access to traditional water sources.
Sanitation access baseline and changes:
Question 5 of 17: What type of toilet facility does your household mainly use?
Comprehensive sanitation options:
-
Flush toilet connected to a piped sewer system
-
Flush toilet connected to a septic tank
-
Flush toilet connected to a pit latrine
-
Ventilated improved pit latrine (VIP)
-
Pit latrine with slab
-
Pit latrine without slab
-
Composting toilet
-
Bucket toilet
-
Open defecation
-
Other (please specify)
Following WHO/UNICEF standards, this categorization distinguishes between safely managed sanitation, basic sanitation, limited sanitation, and unimproved or no facilities. The type of sanitation facility directly affects disease burden, particularly for children.
Question 6 of 17: Has the cleanliness or availability of your toilet facility changed in the past year?
Four options:
-
Improved
-
Stayed the same
-
Worsened
-
Don't know
Sanitation improvement is a tangible community benefit conservation projects claim but rarely document systematically. If adoption fees flowing to communities enable families to build improved latrines or maintain facilities better, this question captures that impact.
Why water and sanitation questions matter for forest adoption:
These seem tangential to forest protection, but they're central to the adoption value proposition. Corporate adopters and conservation foundations aren't just buying tree protection—they're investing in community wellbeing.
The SDG 3 survey provides evidence that investment works:
Baseline establishes starting conditions. Before claiming conservation improves health, you need to document what health access looked like initially. If communities relied on surface water and practiced open defecation, there's substantial room for improvement.
Temporal tracking shows project impact. Asking "has X changed in the past year" directly measures whether conservation project implementation correlates with improving conditions. Multiple survey rounds over months and years show trajectories—steady improvement, stagnation, or decline.
Anonymous responses protect honesty. Communities might hesitate to report worsening conditions in face-to-face interviews with project staff. Anonymous surveys enable honest feedback.
Dashboard metrics for adopters become concrete. Instead of "we support community wellbeing," adopters see "68% of households report improved water access, 43% report improved sanitation facilities" based on anonymous community surveys. That's defensible ESG evidence, not marketing claims.
Health outcomes link to forest protection mechanisms. Improved water access might result from watershed protection—forests protected upstream improve downstream water quality. Better sanitation might result from adoption revenue enabling infrastructure investment.
Remaining SDG 3 questions cover:
-
Healthcare access and quality changes
-
Air quality perception
-
Disease prevalence and changes
-
Nutrition and food security
-
Maternal and child health access
-
Overall household health trajectory
Biodiversity Survey — Connecting Ecosystem Health to Human Health
The biodiversity survey documents ecosystem recovery whilst capturing environmental health indicators that affect community wellbeing.
Question 1 of 7: Observed Species Type
Multiple selection:
-
Bird
-
Fish
-
Mammal
-
Reptile
-
Plant
-
Other (specify)
Question 2 of 7: Species Name
Open text field: "Enter text"
The open text flexibility matters in the Bolivian Amazon context. Indigenous communities have deep traditional ecological knowledge. They know species by local Spanish names, indigenous language names, or descriptive identifiers. Capturing that knowledge in communities' own terms respects their expertise whilst building valuable biodiversity records.
Question 4 of 7: Photos and Videos Upload
Three prominent buttons:
-
Take Photo (blue, camera icon)
-
From Gallery (green, gallery icon)
-
Select Video (purple, video camera icon)
Upload area shows: "No files selected / Files will be uploaded when submitted"
The offline upload capability is essential. Remote Bolivian Amazon communities don't have reliable internet. Community monitors document observations during forest patrols, then upload when they reach areas with signal.
Visual documentation transforms species observations from "I saw a jaguar" to GPS-tagged photo evidence with timestamp. Over months, the photo library becomes an ecosystem monitoring database.
Question 5 of 7: Audio Recordings for Birds
Large blue circular microphone button
"Tap the microphone to start recording"
Bird vocalisations are particularly valuable in dense rainforest where visual observation is challenging. Audio recordings enable AI species identification from calls and songs, acoustic diversity assessment showing ecosystem health, and traditional knowledge capture.
For adopters viewing the dashboard, audio recordings add immersive evidence. Hearing the rainforest soundscape of their adopted parcel creates emotional connection that statistics alone don't provide.
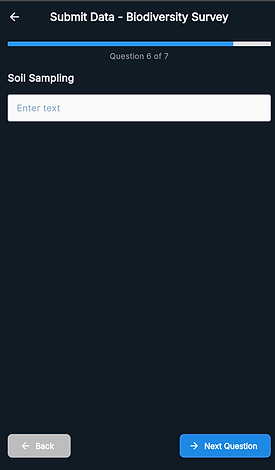
Question 6 of 7: Soil Sampling
Open text field: "Enter text"
This invites narrative observations about soil colour and texture changes, erosion patterns, earthworm presence, moisture retention—capturing indigenous knowledge about soil that scientific assessments might overlook.
Tree Survival & Growth Survey
Plot identification (GPS-tagged location)
Tagged tree measurements (height, diameter)
Health status assessment (5-point scale: Excellent / Good / Fair / Poor / Very Poor)
Threats observed (Multiple selection: Illegal logging attempts / Fire risk / Pests / Disease / Other)
Photo: Tree condition (Camera/gallery upload with GPS tag)
Regeneration presence (Yes/No + species if yes)
Tree-level monitoring provides ground truth. Satellite data shows canopy cover, but community monitors document what's actually happening to individual trees—validating that forests are thriving, not just persisting.
Protection Activity Documentation
Type of patrol/activity (Boundary monitoring / Threat response / Community meeting / Training)
Date and duration (Datetime + hours)
Area covered (GPS route or points)
Threats detected (Yes/No + description if yes)
Actions taken (Open text)
Photo: Evidence of activity (Camera/gallery)
This survey turns protection claims into documented evidence. Instead of "communities protect the forest," adopters see documented patrols with GPS tracks, photos showing community monitors at boundary markers, narrative descriptions of how illegal logging attempts were deterred.


What Corporate Adopters Actually See on the Dashboard
When a corporation or foundation adopts a Bolivian Amazon parcel and logs into their monitoring dashboard, they see impact translated into comprehensible metrics and visualizations.
Health & Wellbeing Module (SDG 3):
Visual indicators showing percentage of community households reporting:
-
Water access: Improved (68%), Stayed the same (24%), Worsened (5%), Don't know (3%)
-
Water quality: Improved (71%), Stayed the same (22%), Worsened (4%), Don't know (3%)
-
Sanitation access: Improved (43%), Stayed the same (51%), Worsened (3%), Don't know (3%)
-
Sanitation quality: Improved (38%), Stayed the same (54%), Worsened (5%), Don't know (3%)
Timeline graphs showing how these percentages change monthly. If water access "improved" responses increase from 45% in month one to 68% in month six, that upward trajectory is visible.
Biodiversity Observations:
Interactive map showing:
-
147 species observations recorded across adopted parcel
-
23 unique species identified (photos and audio recordings linked)
-
8 threatened/endangered species documented
-
Bird audio recordings: 34 files with species identification
-
Mammal sightings: jaguar (2), tapir (5), howler monkey (12), capybara (8)
Forest Protection Activity:
Timeline showing:
-
48 community protection patrols conducted
-
6 illegal logging attempts detected and prevented
-
127 tree health measurements recorded
-
94% average tree survival rate across monitored plots
-
Zero fire incidents in adopted parcel area
Community Engagement Health:
Metrics showing:
-
34 active community monitors
-
512 total surveys completed across six months
-
Badge progression: 8 Forest Friends, 3 Tree Tenders, 1 Woodland Warrior
-
Average response time: 1.2 days from field observation to data upload
What This Dashboard Does for Corporate ESG Teams:
Evidence for sustainability reports. "Our adopted Bolivian Amazon parcel covers 1,500 hectares protected by indigenous communities. Over the past year, community surveys documented 68% improvement in water access, 43% improvement in sanitation, 23 species including 8 threatened species observed, 48 protection patrols conducted, 6 illegal logging attempts prevented. Anonymous community feedback indicates 82% of households report conservation improves their wellbeing."
Defensible claims against greenwashing accusations. The response isn't "we trust our NGO partner"—it's "here's six months of community-documented data showing forest protection, biodiversity recovery, and community health improvement."
Employee and customer engagement assets. Share jaguar photos from community monitors, audio recordings of dawn chorus, testimonials from surveys about improved water access and health outcomes.
Premium positioning. The SDG and biodiversity documentation elevates credit quality and adoption value. Documentation proves conservation benefits both nature and people.
What Makes This Different from Traditional Conservation Funding
Traditional conservation funding operates on trust and retrospective reporting. The adoption model operates on transparency and real-time documentation.
Traditional approach:
-
Annual reports with aggregated statistics
-
Limited visibility into day-to-day activities
-
Community benefit claims hard to verify
-
Funders can't see performance until yearly cycle ends
Adoption approach:
-
Monthly dashboard updates with specific metrics
-
Continuous community-led monitoring
-
Anonymous SDG surveys documenting health improvements
-
Problems visible early, allowing intervention
The transparency creates accountability. Poor performance can't hide in annual summaries. Community health improvements (or declines) are documented through anonymous surveys, not claimed in project narratives.


Why This Scales Beyond Bolivia
This model doesn't require specific geography or carbon methodologies. It requires:
-
Communities willing to document protection activities
-
Smartphone-based monitoring tools
-
Dashboard interface for funders
-
Transparent outcomes including health impacts
WWF reserves could use this for tiger conservation in India—documenting patrols, wildlife sightings, and community water access from protected watersheds.
Coral restoration could use this in Indonesia—documenting reef recovery, fish populations, and fishing community nutrition improvements.
Wetland restoration could use this in North America—documenting bird migrations, water quality, and downstream community flood protection benefits.
The platform does four things any conservation initiative needs:
-
Makes monitoring affordable through smartphone-based community documentation
-
Creates transparency at scale through dashboards aggregating community data
-
Enables adoption markets by making outcomes visible to funders
-
Proves conservation benefits people through SDG health outcome documentation
What Bolivia Proves for Conservation Globally
When the pilot data shows that adoptable Amazon parcels with community monitoring create transparent conservation outcomes—including documented improvements in water access, sanitation, and community health alongside biodiversity recovery—the implications extend globally.
It proves conservation can be transparent, not opaque. That funders can see their investment working for forests and people. That communities can document their own wellbeing changes. That digital tools enable monitoring at costs previously impossible. That adoption creates emotional connection traditional donations don't.
Most importantly, it proves conservation can attract funding based on documented performance including health outcomes, not just reputation and promises. When corporations can point to "68% improved water access" from anonymous community surveys alongside "23 species documented including 8 threatened," that's defensible impact.
The Amazon parcels communities protect become proof that conservation can work differently—more transparently, more accountably, more engagingly. And that proof, documented through smartphones showing forests protected AND communities reporting improved water, sanitation, and health, might transform how conservation is funded globally.

Your Project
Could Work Like This
If you're working on a climate or environmental project that needs verified community data, you're probably facing similar questions to the ones in this case study.
How do you prove your project is working beyond just the technical metrics? What data do your funders need for carbon credits or ESG reporting? How do you catch problems on the ground before they undermine your results? Most importantly—how do you ensure the people affected by your project actually understand and benefit from it?
The difference between projects that succeed and ones that struggle often comes down to whether you're measuring the right things. Carbon calculations tell you about emissions. Community feedback tells you whether the intervention is actually working in practice. Education ensures that feedback is informed, not just reactive.
We've built the survey systems, education modules, and geotagged monitoring tools that made this project work. The same approach adapts to your context—different activities, different locations, different communities, different objectives.
What you get:
-
Custom education modules that teach participants about what they're monitoring and why it matters
-
Multilingual surveys designed for offline use in areas with limited connectivity
-
GPS-tagged responses that show location-specific patterns and problems
-
Anonymous feedback systems that protect privacy whilst collecting honest data
-
Verified data packages that meet carbon credit, MRV, and ESG reporting requirements
-
Operational insights that help you fix problems before they become failures
What your project needs:
-
A climate, environmental, or development initiative (planning stage or already operating)
-
Community members whose participation and feedback would strengthen your project
-
Funders or stakeholders who want proof of impact alongside technical metrics
The platform works whether you're monitoring 10 hectares or 10,000, whether you're in a remote village or an urban centre, whether your participants speak Spanish, English, French, Hindi, Indonesian, or Ukrainian.
Get Started
If you're working on a project that needs more than just technical data—where community engagement and verified feedback actually matter—let's talk about how this approach could work for you.
Or if you're not sure whether this approach fits your situation, send us a quick message describing what you're trying to achieve. We'll tell you honestly whether education-based community monitoring makes sense for your context.
Email us: nick@citizenclimate.net